The content contained on this webpage represents the opinions of Equilibrium Investment Management and in no way constitutes a solicitation of investment advice. It should not be relied upon in making investment decisions and is intended solely for the entertainment of the reader. Past performance is not a guide to future returns. The value of your investments can fall as well as rise and are not guaranteed. Investors may not get back the amount originally invested.
Market briefing 26th March 2020
Volatility can seem a scary word, but thankfully it can also refer to ups as well as downs!
Markets remain very volatile. On Monday (23 March), equities fell extremely sharply and the FTSE 100 closed below the 5,000 mark for the first time in almost a decade.
Then on Tuesday, we saw a huge rally of over 9% for the FTSE 100. This was the second-best one day gain on the market EVER.
This is great news of course and we hope that this is the beginning of a recovery. However, we have to sound a note of caution at this stage.
Table one shows the top 10 largest daily gains on the FTSE 100:
Table One
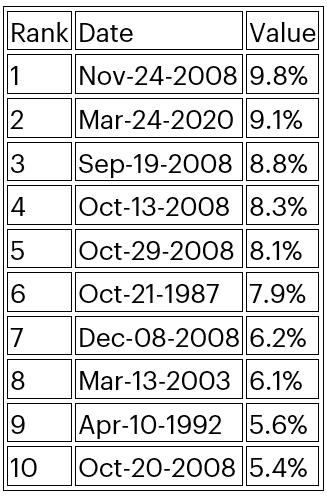
Source: Refinitiv / Money Observer
It is worth noting that six of the top 10 biggest rises happened in late 2008. This was in the really scary period of the financial crisis when Lehman Brothers had just gone bust and before governments and central banks had brought out the full stimulus that was to eventually come.
Despite the occasional large rallies, the stock market didn’t actually bottom out until March 2009.
This move feels like a classic bear market rally and I, therefore, suspect we could go lower again before we can move much higher. Having said that, markets gained another 4%+ on Wednesday so hopefully, I am wrong about this!
I have commented several times that the current situation in markets feels very similar to the credit crunch but on fast forward. We have seen some of the similar characteristics such as the lack of liquidity in the market, and the increase in correlations between asset classes. Assets that usually go up when stocks go down have instead fallen at the same time.
This is a simplistic way of looking at it, but if we ARE operating on a similar model to 2008 but on fast forward, then that is also a point for optimism. Whilst I suspect we could see markets drop before rising again (and I emphasize this is only my feeling), I also hope that the proper rally will come sooner rather than later.
If only central banks could cure the virus…
Certainly, central banks and governments have been much quicker to address the financial issues than they were in 2008. The fiscal packages put together by the UK and US governments (which are still to be finalised at the time of writing) go a long way, although I suspect they may need to do still more.
The essentially unlimited quantitative easing (QE) and other support we have from central banks has already improved liquidity and stabilised bond markets.
This is all positive but as we’ve said all along, central banks can’t cure the virus.
In the UK, the authorities have now taken decisive steps to address the spread of the virus, even if it is possible we might not have gone far enough or quick enough. In the US they are still dithering and this will continue to concern markets.
My suspicion is we might get a true recovery when we get past the peak of new cases. In China, South Korea and Japan, we may already be over the peak and markets here have rallied strongly recently.
Even in Italy, there are possible signs that new cases of the virus are beginning to slow down. In the UK and US we are still on the upward trajectory at present.
When the facts change, we change our minds
In previous briefings, we’ve tried to explain that, because this is a fast-changing situation, we need to continually adapt our strategy.
As we get new information then we may need to change tack, even if this means acknowledging we were wrong previously.
One way we’ve done this is in our volatility trades, where we buy equities on a dip and try and sell on a rally.
You may recall that having bought at 6,750 we changed our minds for cautious and balanced investors and sold it again at 6,800.
We then put some of this money back into the market at around 6,550, which in hindsight was of course still too early.
On Wednesday, (25 March) we decided to sell some of our volatility trade position at around 5,600. We have now set a new trigger to buy back at around 5,000.
Markets have repeatedly tested the 5,000 level in the past week or so, but so far have generally bounced from there. We genuinely hope we never get the chance to buy at this level and the sale turns out to be a mistake!
However, if this does turn out to be a bear market rally then we can at least reduce some of our exposure to the downside, and use further dips as buying opportunities.
If we do buy back at 5,000 we will aim to sell again at 5,250, roughly the range of returns we saw over the past week, bar a couple of days either side.
Defined returns strategy
In my previous update, I explained that defined returns had performed much more poorly than we had expected.
In most market dips, we see defined returns fall perhaps 80% of the fall in the market. In the recent moves, they have actually fallen by more than the market. Significantly so, in some cases.
This is both a source of pain in terms of losses, but also illustrates the reason we need to hold our nerve.
All of the defined returns products were issued at £1 per share. As of the close on 25 March, they were all trading at less than £1. Table 2 shows the indicative prices of each of the products if we had chosen to sell them at that point.
Table two:
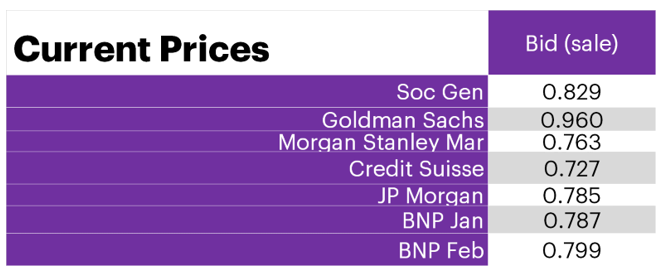
Source: Refinitiv / Equilibrium Investment Management
These prices are in fact significantly higher than they were on Monday (23 March). On this day, Morgan Stanley was priced at 61p and Goldmans at 80p.
That is an increase of 24% for Morgan Stanley in two days! For Goldman Sachs, it is 20%.
These products have proven far more volatile than the market in the past few weeks, falling more when they drop but also gaining more when they rally.
This is very strange behaviour for something that is generally more resilient than the market.
Defined returns are a form of so-called structured products. These are actually a package of different financial instruments, structured in such a way as to achieve the returns stated.
They are made up of two different types of instruments:
- Equity market options
- A bond with the investment bank
As markets fall, the equity options become less valuable. This has been compounded by the major increase in volatility we have seen, which increases the cost of hedging.
The bond is very similar to any corporate bond issued by the bank. If the perceived quality of the bank falls, the bond is worth less. In the current environment, investors have been loath to lend money to anybody!
Our products have therefore been hit by both sides of the equation.
Volatility = opportunity?
As a reminder, these products will pay out a fixed “coupon” on the anniversary of the date that they were set up, provided markets are above where they were on that start date. They don’t need to go up over the term, they just need to go sideways.
Each product also has an element of capital protection built into it. If the market has fallen but is above the so-called “barrier” at the end of each product’s individual six-year term, the product will mature at the same £1 per share at which it was issued. The barrier is usually 40% below the starting level.
Chart one illustrates where the barrier levels are for our individual products in terms of FTSE level and time. It also shows how the FTSE has moved over the past two years, and where the market will need to be in the future in order for the capital protection to kick in:
Chart one:
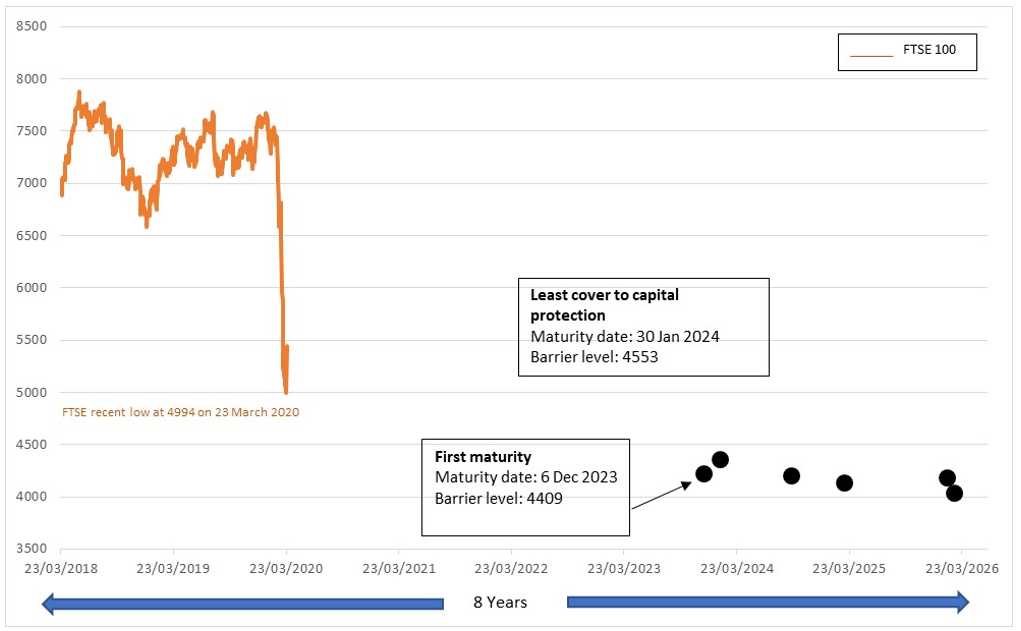
Source: Equilibrium Investment Management
The oldest product we have in the portfolio is also the first to mature (if not kicked out beforehand) in December 2023. If the market is above 4,409 on this date then the product is worth £1 per share, not the 82p it is currently priced at. If the market s above 7,348 at any anniversary up to 2023 it also pays out 9.5% pa on top of this.
The product which was struck at the highest market level is from Credit Suisse. This also has the highest barrier level, of 4,553 and it matures in January 2024.
Table three shows what return we may get from this product based current prices and market levels, and different market movements.
Table three:
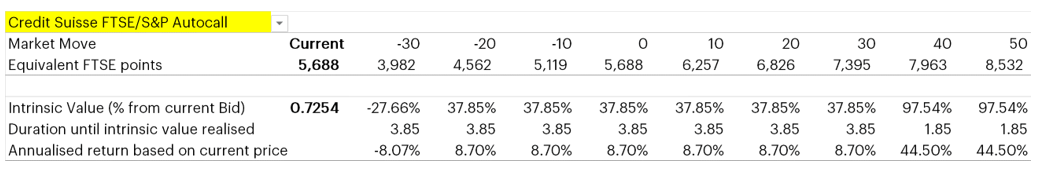
Source: Refinitiv / Equilibrium Investment Management
In essence, the market can drop 20% over this period and we still get almost a 38% gain or 8.7% pa from current levels.
Table four shows the same thing but for the Goldman Sachs product, which was struck two weeks ago when the FTSE was at 6,000.
Table four:
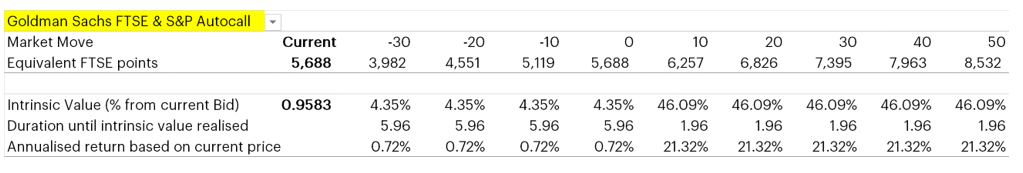
Source: Refinitiv / Equilibrium Investment Management
A 10% increase in markets leads to a 46% total gain and a 21% pa total return. This is assuming the return stated in the table occurs over the next two years unless that would not lead to a kickout in which case it assumes it is held until the final maturity date.
We see this type of pricing as a great opportunity.
Having seen defined returns fall by more than the market, we have decided to switch some money out of direct equities and into defined returns instead.
This means switching out part of the FTSE 100 tracker fund we bought in one of our volatility trades. We are not increasing equity market exposure but we think we are buying something with more potential upside, which is also more defensive in the event that markets fall further.
Rather than top-up any single product, we have topped up the Atlantic House Defined Returns fund. This has the added bonus of being mainly collateralised by cash and short term gilts, which means it does not have the credit risk of some of the individual products.
Table five shows what return Atlantic House think they could achieve based on different market movements. The table was from Friday 20 March when the FTSE was at 5,151.
Table five:
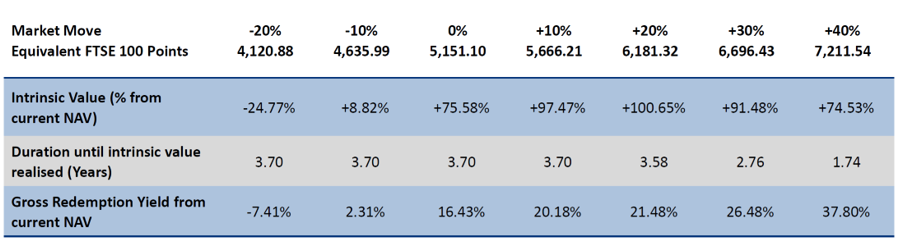
Source: Atlantic House Fund Management
If the market falls 10% from where we were last Friday, we still get a 2.3% pa return from that point. If it goes up 10% from those levels (to 5,666 – actually below where we were at close on Wednesday 25 March!), the gain is over 16% pa over 3.7 years until all the products kick out.
We have talked about not making big changes to portfolios too hurriedly. However, we think small tweaks like this can add to possible returns and (in our view) make the portfolio more resilient as well.