“My friend’s portfolio has returned double digits.”
This statement is something we come across on a regular basis, and is such a throwaway comment without context, that it creates more questions than answers.
One of the first questions we pose is, how long has it taken to achieve this? Such a return over a single year is impressive, but is the same true, say, over 5 years?
Even beyond this, if a client achieves a 10% return the year after a 10% loss, they will have less than they started with!
Comparing apples with pears
Historically, we have been our own worst enemy when it comes to reporting performance. For years, we have been sending clients their portfolio returns, along with the return of the FTSE 100 over the same period. This was done with the best of intentions, to help our clients relate to a market they already understood.
However, instead of it being used purely for information purposes, a number of clients were anchoring their own returns to the FTSE 100 and benchmarking Equilibrium to the index.
So, how did this pan out? In times of falling markets, our portfolios did well, but in a rising market, the opposite was so. This is to be expected as we would be comparing an index that is 100% equity to that of our core funds which have broadly half the level of equity exposure. It is human nature to only remember the high points and it is at those points when our portfolios would always underperform the FTSE 100. Nobody tends to store the steady years in their subconscious.
A relevant metric?
We agreed it was time to move away from the FTSE 100 towards one that is more comparable on a risk adjusted basis.
When it comes to investment comparators, there are a myriad of benchmarks that could be used, but it is key to ensure we are comparing apples with apples.
The Equilibrium funds have previously been in the IA (Investment Association) unclassified sector as they were not correlated to any particular sector. As an alternative, it was felt appropriate to have fund objectives linked to the base rate or inflation. For example, the objective of the Equilibrium Balanced Fund is that it aims to deliver returns greater than inflation over a minimum of 5 years (and an average of 5% per annum above CPI over any 10 year period).
While we still feel this is the key measure, we want to help clients compare our funds to competitors in a more suitable way. As the makeup of the Equilibrium funds has changed, they now have a greater correlation to particular sectors giving a relevant comparator. Using the Balanced fund as an example, the two most common measures used are IA and ARC (Asset Risk Consultants).
The IA Mixed Investment 20 60% Sector sets the parameters of how much equity can be held within a fund to meet the criteria. There are currently 433 UK funds that make up this sector, including offerings from investment heavyweights such as Aviva, Invesco and Scottish Widows. The benchmark return is simply calculated by taking an average of the returns of the constituent parts.
The ARC Indices are a set of benchmarks that harness data from more than 120 wealth managers such as Brewin Dolphin, Tilney and Coutts and are made up of literally hundreds of thousands of private client portfolios. As with the IA sector, the ARC Indices limit equity exposure but to a slightly narrower remit of 40 60%.
Keeping long term in mind
So how do we measure? We place a lot of credence on long term investing, preferring to assess performance over a 10 year period. To remove any accusations of bias over the timeframe, we use calendar years as easily identifiable, indiscriminate reference points.
The results in Table one show that in 9 out of the 10 years, our Balanced fund outperformed at least one of its comparators (the IA sector or the ARC Indices) which, as active investors, would typically please most clients. However, recency bias is evident amongst clients due to the latest calls made by the investment team and the subsequent impact. While these decisions may have slightly affected short term performance, their aim is to deliver long term outperformance.
Table one: Equilibrium Balanced fund versus its comparators
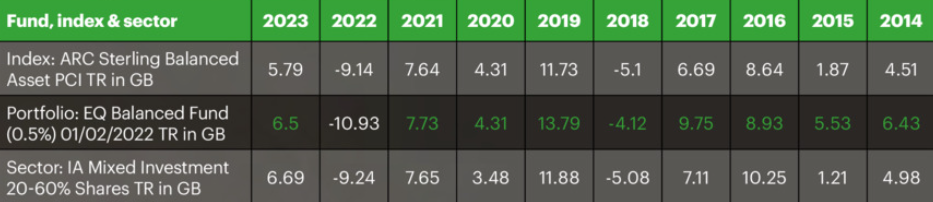
Source: FE Analytics / Equilibrium Investment Management. Numbers in green indicate the outperformance of at least one of the benchmarks
Playing your game
At Equilibrium, our core message is excessive risk is unnecessary and the strategy within our funds reflect that approach. Given the varying risk profiles within the fund range, we are confident we can blend them together to meet a client’s needs and ultimately achieve their goals. However, with a dedicated in house investment team, we can also cater to bespoke requests from clients.
If asked to create a portfolio with the potential to outperform the FTSE 100 over a 10 year period, for example, the investment team would willingly take up the mantle.
To illustrate this, we might look to blend our Defined Returns contracts with a FTSE Tracker and then take an overweight position in either a specific geographical region or specific sector. These three components not only offer the potential to outperform but the investor also experiences less volatility.
Read more
To find out what six attributes you need for investing, read our article on being A response-able investor.
This article is intended as an informative piece and should not be construed as advice.
Past performance is for illustrative purposes only and cannot be guaranteed to apply in the future.