A hint of optimism
Executive Summary
- Annual inflation in the UK in October was over 11%, driven by the increase in the energy price cap. However, there will be no further energy price increases for the next 6 months due to government intervention.
- In addition, several commodity prices have moderated recently which could reduce future inflationary pressures.
- The US inflation rate was lower than expected in October which raised investors’ hopes that interest rates may be close to the peak. Bond and equity prices moved sharply higher as a result.
The latest UK inflation figures are the highest we have seen for 41 years.
Consumer price index (CPI) inflation over the 12 months to end of October 2022 was 11.1%, up from 10.1% p.a. as of the previous month (Source: Office of National Statistics – ONS).
This was slightly higher than most economists had expected (around 10.9% p.a. according to the FT). However, a steep increase was not unexpected. The good news is there are reasons to believe that inflation could moderate from here.
The preferred measure of inflation for many economists is CPIH – the ‘H’ stands for housing costs which are included in this figure but not the main CPI. It is more comprehensive and tends be slightly less volatile than the headline CPI.
In October, this figure was 9.6%. Of this, 3.68% comes from the housing and household services category – the biggest driver of which is energy bills. This means 38% of annual inflation is explained by the increase in energy costs. In October, the price cap for energy bills was revised upwards, which is why we saw such a sharp jump (Source: ONS).
The good news is that we will now have no further inflation in our energy bills for the next six months as the government will cap the price we pay for that period of time.
It is worth remembering that inflation is always quoted as an annual figure, looking at how much prices have grown from one year to the next.
As we move through the year, some of the previous gains in energy prices will therefore start to drop out of the annual inflation figure, meaning that it should naturally come down.
Of course, the new price cap only applies for six months, after which the cap moves to a higher level. However, there will be more targeted support to help lower income households.
Wholesale changes
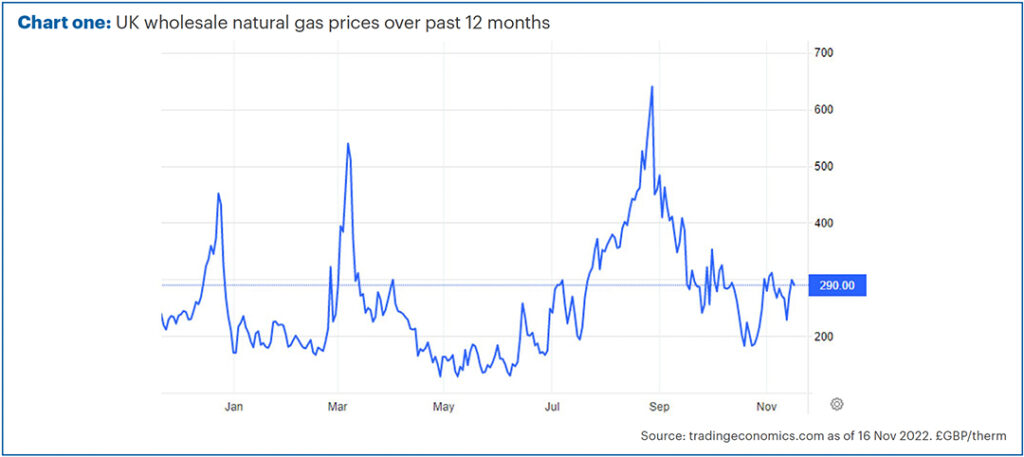
In the Pulse a few months ago, I included a chart of the wholesale natural gas price – the price at which your energy provider pays to purchase natural gas on the market. As the biggest driver of inflation, I said I thought this was the most important chart right now.
Chart one is an updated version, showing how the price of gas has changed over the past year. As you can see, the price for each therm of gas is now only slightly above where it was 12 months ago. Importantly, it has more than halved since the late summer.

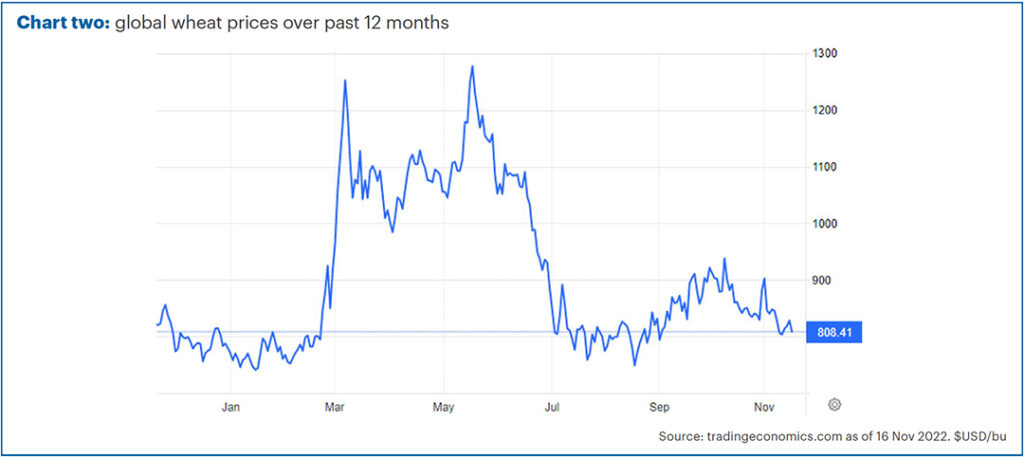
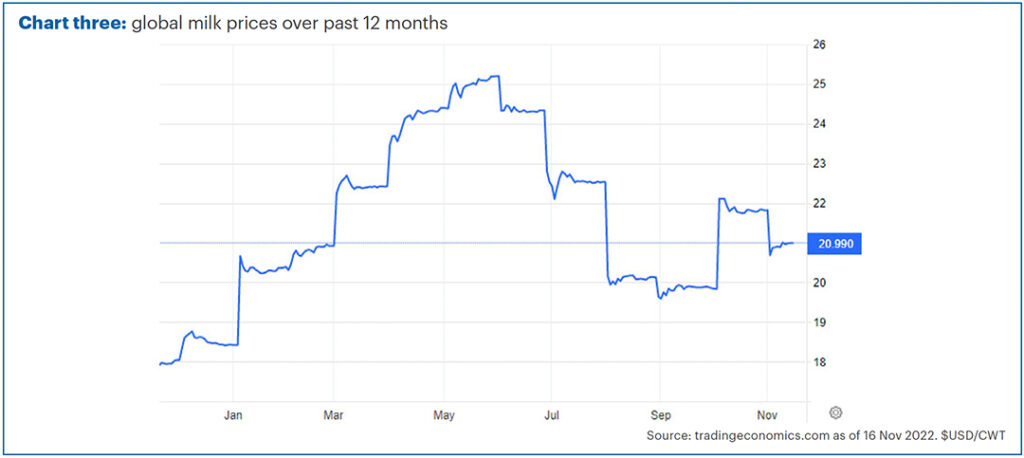
Another 1.48% of the 9.6% CPIH figure (15% of inflation) is from food and drink prices. Principally this is mainly due to an increase in dairy products and wheat-based products like pasta and bread.
Charts two & three show the global wholesale wheat and milk prices over the past 12 months. As with natural gas, both of these are significantly down on where they were a few months ago.


It is important to say that we don’t know what will happen to the price of these commodities from here – they could go back up again or fall back further.
However, if it just remains where it is, then the effect on the headline inflation numbers will eventually wane as previous increases drop out of the annual inflation numbers.
This doesn’t mean prices will decrease, but the rate of change, which is what inflation figures measure, will likely slow.
It is also worth pointing out that there is a lagging effect because these are wholesale prices and manufacturers may take time to pass costs (or savings) on to consumers. They often also buy forward contracts (i.e., agreeing now what price they will pay for delivery in six months’ time), and this takes longer to adjust than the ‘spot price’ (the price for immediate delivery).
We can’t predict what will happen to these prices in the future, but we can look at what’s happened over the past few months, and we can see that underlying inflationary pressures have reduced (for now).
Important inflation
As a reminder, the reason this is so important is that high prices are the principal reason why the economy is struggling. It is also why interest rates have had to rise so quickly.
These two factors are the main reasons why many assets, including most equity and bond markets, have fallen sharply this year.
We recently held our latest quarterly update at The Mere Golf Resort & Spa. If you were unable to attend, you can sign up for our event on demand here.
I ended my presentation by showing charts similar to those in this newsletter. I expressed an opinion that should inflation start to drop back, particularly if we got a surprisingly low figure, then this could be a trigger for markets to rally sharply.
I had not expected this to happen the same day! That afternoon (10th November), the latest US inflation figures were published. Unlike here in the UK, this time inflation showed clear signs of slowing, dropping from 8.2% in September to 7.7% in October.
More importantly for markets, this figure was well below the expected level of 8% p.a. (according to the FT) and many of the most important categories showed clear signs of moderation. In fact, if you exclude shelter (principally the cost of rents or equivalent), then core prices actually fell from one month to the next.
On this announcement, US equity and bond indices jumped as investors re-appraised the need for the Federal Reserve to keep hiking interest rates. The tech-heavy Nasdaq 100 index, perhaps the most sensitive asset class to changes in rates, jumped by 7.5% in a single day. That’s the most since March 2020. (Source: FE Analytics)
Bonds and equities outside the US also gained, although less sharply.
The expectations for slower rate hikes also meant that the US dollar fell sharply, which reduced the gains on US stocks for sterling-based investors but is typically a good sign for many other assets.
Of course, one swallow does not make a summer. In order to see a more sustained rally in various assets we would like to see more evidence that this is a change in trend and not just a one off.
We would reiterate that we don’t have a crystal ball and can’t say what will happen to prices from here. However, recent underlying trends have yet to be seen in headline annual inflation and simply staying where we are would see inflation fall through simple arithmetic.
Whilst prices remain high and this is very challenging for a lot of us, we therefore think there are reasons to be optimistic about what happens from here. If so, then we would also be very optimistic of a strong run in the markets.
Past performance is for illustrative purposes only and cannot be guaranteed to apply in the future.
This newsletter is intended as an information piece and does not constitute a solicitation of investment advice.


