
 Mike Deverell
Pandemics and politics
They say that a week is a long time in politics. In the investment world, a week can feel more like a year and a month more like a lifetime!
It is certainly true that a lot has changed in the past month. When I wrote our September newsletter, I discussed the rise in recent COVID-19 cases in the UK. I said that, whilst at the time cases were mainly in younger age groups, it needed watching carefully in case this accelerated or spread to other age groups. We worried that there could be a further impact on the UK economy and that more people could lose their jobs.
Fast forward a month and much has changed. We now have a new three tier approach to containing the virus, with Liverpool in the highest tier which feels like only a step away from full lockdown. At the time of writing, it seems Manchester (perhaps including Trafford and Stockport) is also likely to be put into the “very high” category, which could impact on a significant proportion of our own staff and clients.
We are, of course, following this closely not just because of our personal concerns but because it has an impact on markets and on portfolios.
We therefore track a number of indicators in an attempt to gain some insight into where things might be going. For example, we carry out our own analysis using the data from the government’s COVID-19 webpage.
Charts one to four show some of this analysis. (These are crudely drawn spreadsheet charts and are not very pretty as they are principally for internal use!)
All the charts are calculated using seven day rolling averages based on reported dates and focus on the last three months so we can see short-term changes in trends.
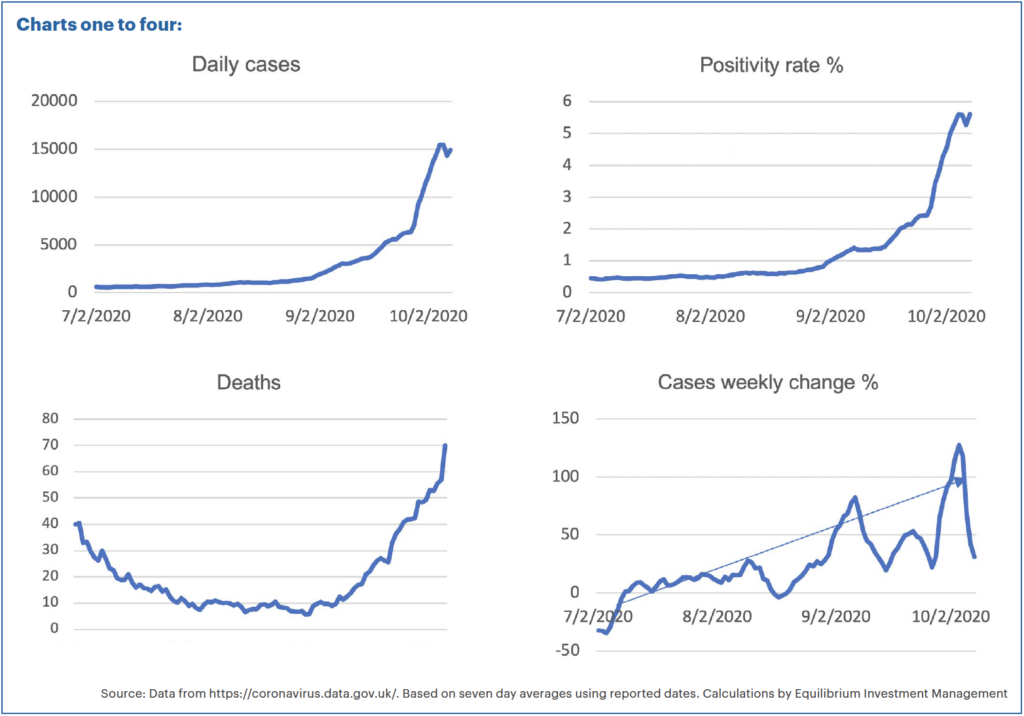
Chart one shows the simple daily reported COVID-19 cases. However, as noted last month, just looking at the number of cases in isolation doesn’t tell us very much, as this can be influenced simply by the fact that we are doing more tests. We therefore also calculate a basic “positivity rate” by taking the number of positive cases as a percentage of the total tests completed.
Chart two shows how this has also risen significantly, showing that positive tests are not simply a function of greater testing.
If positive cases were simply amongst the young and healthy, this might not be an issue, but this no longer appears to be the case. Hospitalisations are increasing and, as chart three shows, we are now seeing more people dying.
Chart four is another way of looking at the increase in cases. This looks at the percentage change from one week to the next. We can see that these weekly increases have generally been accelerating, peaking at over 120% recently (meaning more than a doubling of cases one week to the next). We analyse deaths and hospitalisations in the same way and have seen weekly increases of 60% to 100% here as well.
This is not just us taking a morbid interest. Doing this helped us deem it likely that the government would have to act and that this could hit the economy. This has had an influence on our recent decision to reduce exposure to selected UK stocks, selling our remaining FTSE 100 tracker funds and one of our equity income funds. We have instead switched into more “quality” stocks which we think would be resilient if the economy took a turn for the worse.
We will continue to track this data and we hope it may work in the other direction as well. If we see that the number of cases is reducing or at least decelerating, we may get an early inkling that some restrictions might be lifted. We can therefore decide if it is time to buy back into more economically sensitive stocks and hope to benefit from a recovery.
Big brother is watching you…
Some other “real time” data that we follow are what we call “activity trackers”. These use many different sources to estimate how much economic activity is occurring. The main sources are the big tech firms like Google and Apple.
When we use Google maps on our phones with our GPS enabled, Google is tracking our movement. This is how they estimate how bad the traffic might be, by monitoring how quickly other Google map users are traveling along a particular road, for example.
Google can also tell us how much time people are, on average, spending at home or at various other locations. Personally, this all makes me somewhat uneasy, but it also provides some useful data!
Chart five shows that (unsurprisingly) we are spending more time than usual at home, although less than we were in April.
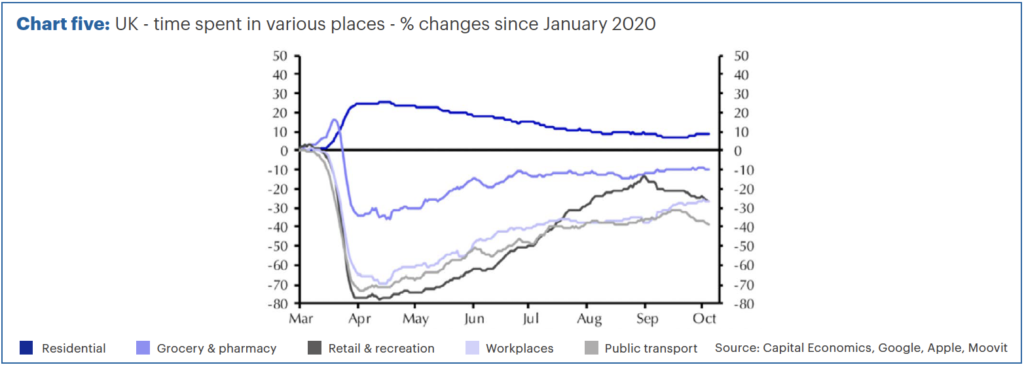
More interesting perhaps is the data from other locations, such as time spent in retail and recreation locations. In April, we were spending 80% less time in such places than we had been in January. This gradually increased until the end of August when we were only 10% or so below pre-COVID levels.
We can then see that this tailed off in September, even prior to the new restrictions.
Economic growth in August was disappointing at only 2.1% (despite a boost from Eat Out to Help Out) when most economists had expected 4% to 5%. The UK economy remains more than 9% smaller than pre-COVID levels and many economists have downgraded their (already low) expectations for the UK.
Chart six combines this activity tracking data into a single metric and looks at various regions. UK activity remains well below many other countries and is now declining.
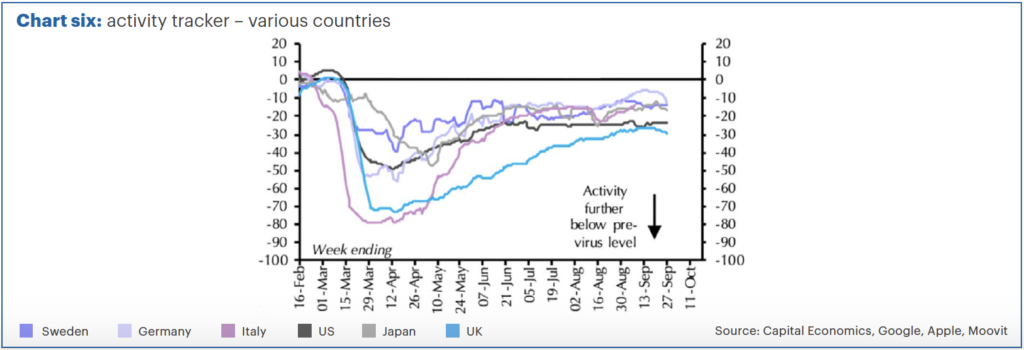
We remain concerned about the long-term impact on the UK economy, particularly if the job retention scheme is not extended and redundancies (which are already higher than at any time since 2008) continue to spike.
We are also watching trade negotiations with the EU carefully as a no-trade-deal Brexit could also have a significant impact. It would likely mean a significant fall in the pound and potentially impact on a wide range of UK assets. Our recent increase to overseas stocks will hopefully provide a hedge in this event.
US election
The big tech stocks such as the aforementioned Google along with others like Amazon and Microsoft have done very well recently despite (or in some cases because of) the pandemic.
Across the Atlantic, both Democrats and Republicans have criticised many of the big tech (and social media) companies for a variety of reasons. This includes privacy concerns, accusations of bias (against both sides!) and monopolistic behaviour.
Joe Biden seems more likely to do something about it than Donald Trump, as well as promising to increase corporate taxes which is perceived as “market negative”.
At present, Biden is around 10% ahead of Trump in the polls. We have, of course, all lost faith in opinion polls recently, but it is worth noting this is 3% better than Clinton was at the same stage in 2016. Clinton of course won the popular vote by around 2.8 million people, but still lost due to the electoral college system.
Another way of looking at this is to look at betting markets. Chart seven shows that betting markets currently ascribe a 68% chance of a Biden victory. This is a significantly different picture to the start of September when they were seen as neck and neck.
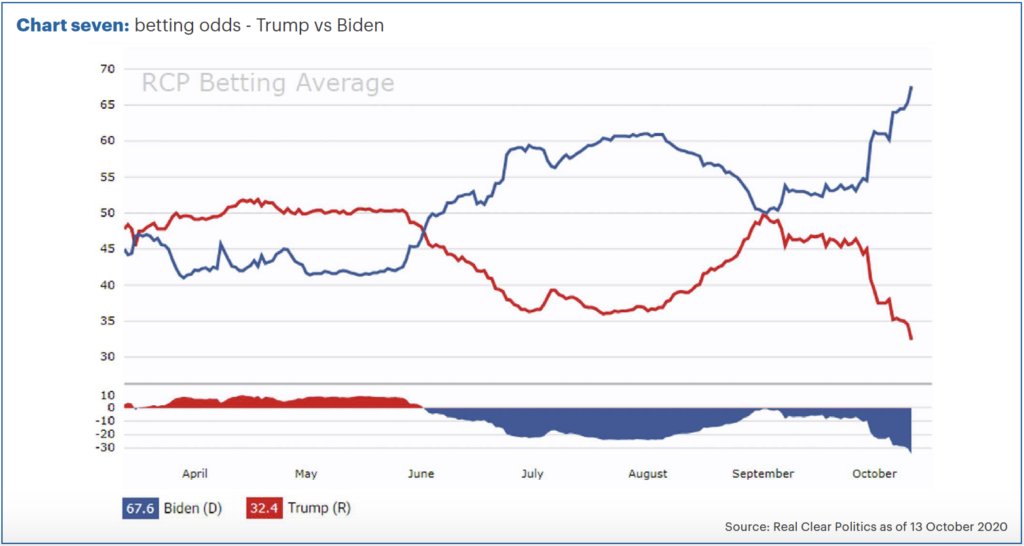
Plenty has changed in the last month or so in the US as well! We had the first presidential debate which Trump was perceived to have “lost”, followed shortly afterwards with he himself contracting COVID-19 and the chaos that subsequently ensued.
What is interesting is that as Biden’s chances of winning increase, the tech stocks have not sold off as many expected. In fact, whilst they had a dip (along with the US market as a whole) at the beginning of September, they have since recovered well.
That minor sell-off happened at a time when the presidential race looked very tight. Many people believe the worst-case scenario would be an unclear result, or one where Biden wins as a result of postal votes. In this instance, many believe that Trump will cry foul and refuse to concede.
As Biden increased his lead the chance of this appears to have reduced and markets have recovered from their dip. There are also certain stocks that may benefit from a Biden presidency. For example, renewable energy stocks have done well recently with Biden promising to increase spending in this area. We have increased our exposure to such stocks recently and so this has lifted returns.
For the big tech names, a Biden presidency in itself would not be too much of a concern. However, should the Democrats take the Senate as well as the House, then they would be empowered to take more action.
We started by saying how much had changed in the past month. The next month could be extremely significant. By then we will know the result of the election and will (hopefully) have a clearer picture regarding Brexit. We will also have a better idea of whether COVID-19 has spread further or been contained.
General economic view
The strong economic recovery from the lows of March seems to have stumbled somewhat of late. With rising COVID-19 cases across the UK and much of Europe, a double dip recession is now much more likely. However, growth in China and the rest of Asia appears more resilient as they have been more effective at controlling the virus.
In this environment, interest rates will remain at close to zero and could even go negative. Quantitative easing will continue and we expect governments to have to increase support in the event of further shutdowns. Inflation could see a short term pick up next summer but we will likely remain in a disinflationary environment for some time.
These represent Equilibrium’s collective views and in no way constitutes a solicitation of investment advice. The value of your investments can fall as well as rise and are not guaranteed. Investors may not get back the amount originally invested. We usually recommend holding at least some funds in all asset classes at all times and adjusting weightings to reflect the above views. These are not personal recommendations, so please do not take action without speaking to your adviser.