
 Mike Deverell
2022 was an unusual year when most asset classes fell.
There were many surprises, with Russia’s invasion of Ukraine and the effects of the UK’s “mini-budget” being amongst some of the more shocking events.
Here we look at some key charts which illustrate just how dramatic some of the moves were.
Prices
Consumer price index (CPI) Inflation went from around 2% p.a. in the US and UK in mid-2021, to 11% in the UK by October 2022. The US CPI peaked at 9% in August and has been slowly falling since.
CPI inflation in the UK and US – past three years

Source: Refinitiv Datastream / Equilibrium Investment Management 2022 (UK CPI – blue, US CPI – orange)
The change looks even more startling in context of the past ten years:
CPI inflation in the UK and US – past 10 years

Source: Refinitiv Datastream / Equilibrium Investment Management 2022 (UK CPI – blue, US CPI – orange)
This was driven to a large extent by commodities. European natural gas at one point was up 400% compared to the price at the start of the year. Wheat was up 200% at one point and oil was up 50%.
However, oil and wheat are now back to roughly where they were a year ago and gas is significantly below peak. If these prices stay where they are then inflation should come back down in 2023:
Commodities in 2022

Source: Refinitiv Datastream / Equilibrium Investment Management 2022 (RFV Natural Gas – light blue, Wheat – Orange, Brent Crude Oil – dark blue). All rebased to 100.
Taking a 10-year view, it is interesting to note that oil and wheat are actually flat over the past decade. Meanwhile, at one point natural gas was up over 1000%!
Commodities – past 10 years
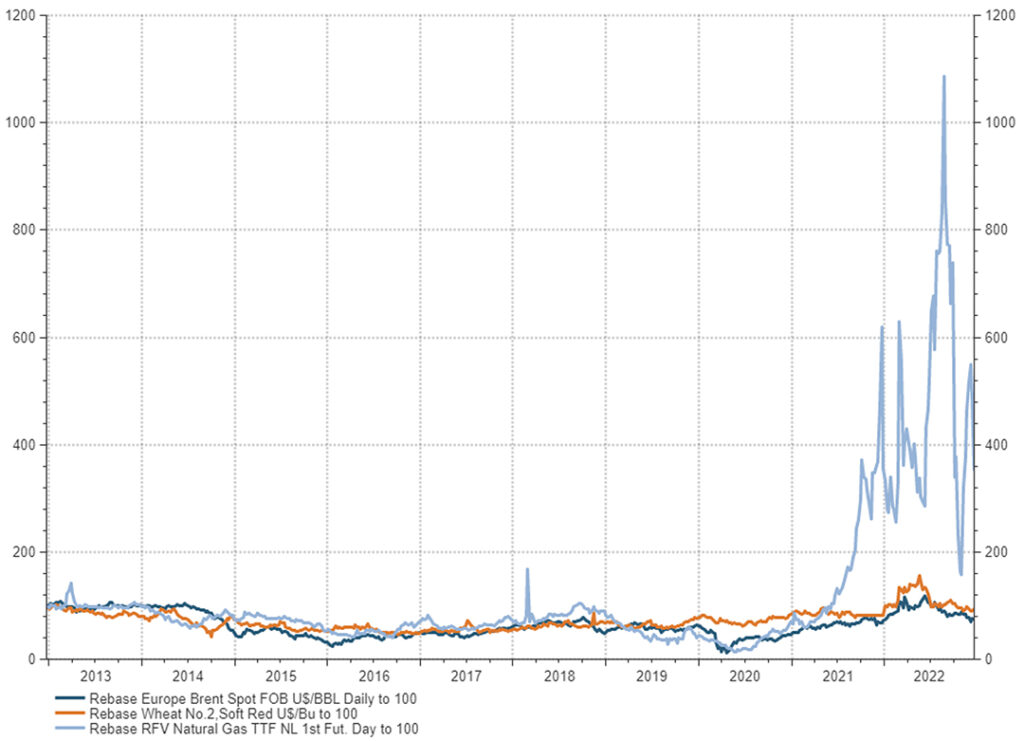
Source: Refinitiv Datastream / Equilibrium Investment Management 2022 (RFV Natural Gas – light blue, Wheat – Orange, Brent Crude Oil – dark blue). All rebased to 100.
Monetary policy
Interest rates in the UK and US have gone from 0.25% a year ago to 3.5% (UK) and 4.5% (US) – this is a huge change in such a short period of time:
Interest rates in 2022
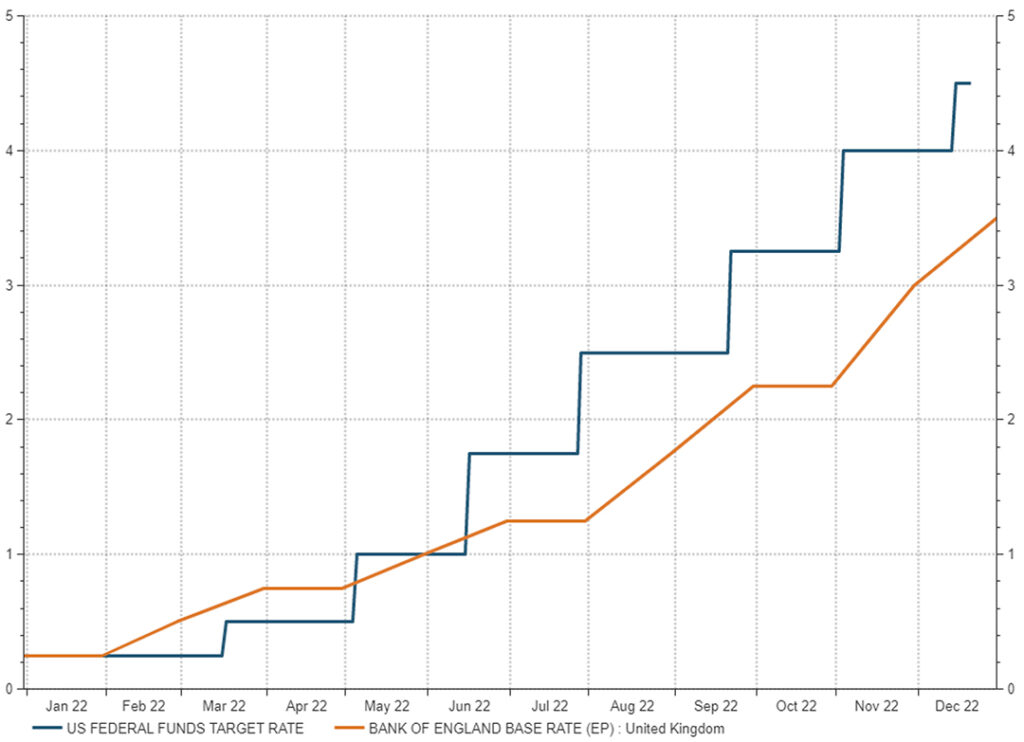
Source: Refinitiv Datastream / Equilibrium Investment Management 2022
Again, in the context of the past decade we can really see the difference – although easy to forget the US had another hiking cycle in 2018 (which led to an equity/bond sell-off):
Long-term interest rates
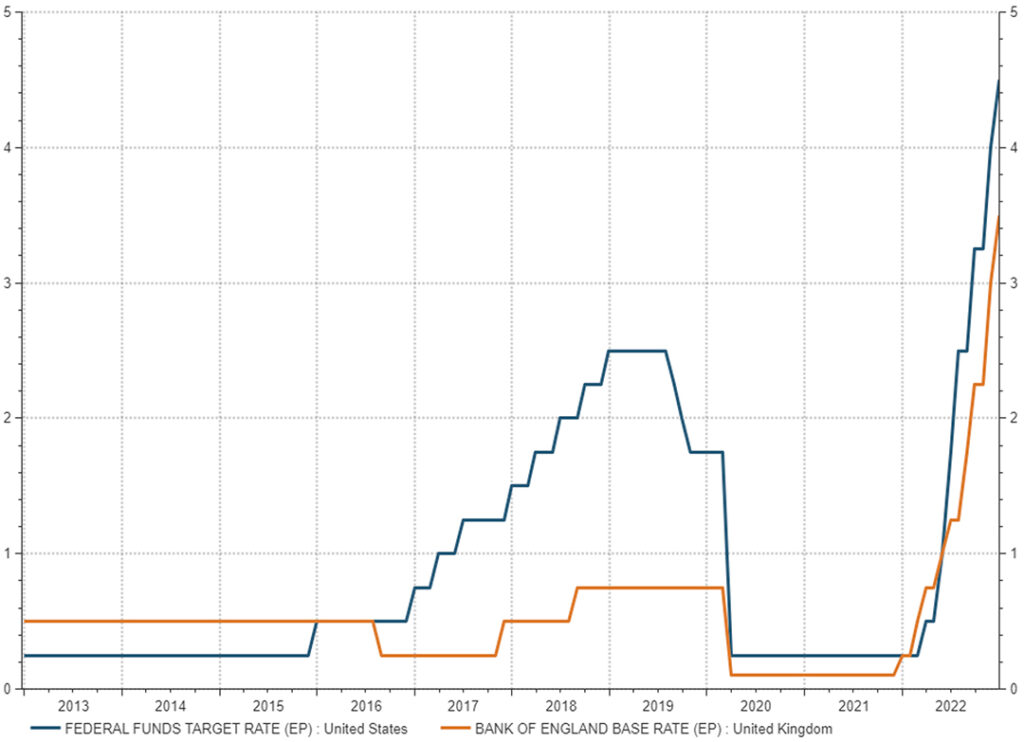
Source: Refinitiv Datastream / Equilibrium Investment Management 2022
Central banks in aggregate stopped purchasing bonds in 2022 (as part of quantitative easing and similar measures) and began selling instead. This is forecast to continue into 2023:
Central bank asset purchases
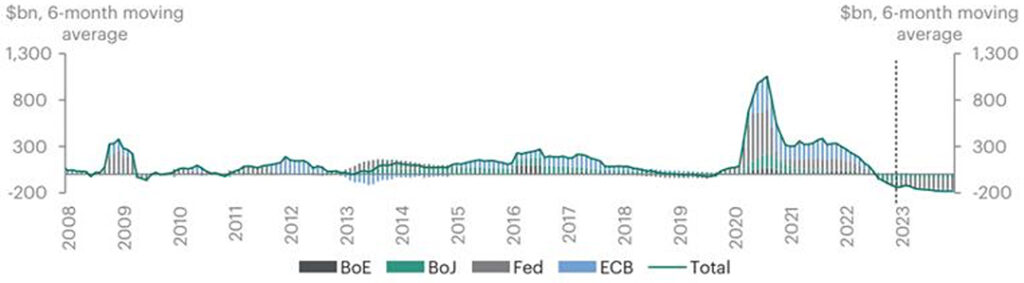
Source: Apollo / Bloomberg 2022
This all contributed to a sharp sell-off in government bonds. 10-year bond yields were 1% (UK) and 1.5% (US) at the start of the year. They both peaked at well above 4% before falling back somewhat. When yields go up, it means prices have gone down.
UK and US 10-year government bond yields in 2022

Source: Refinitiv Datastream / Equilibrium Investment Management 2022
The move in rates has also hit the property market hard, both in commercial and residential. The following chart illustrates why. A UK two-year fixed rate mortgage went from 2% to 6% this year – a 300% increase!
UK fixed rate mortgage costs (2-year 90% LTV)
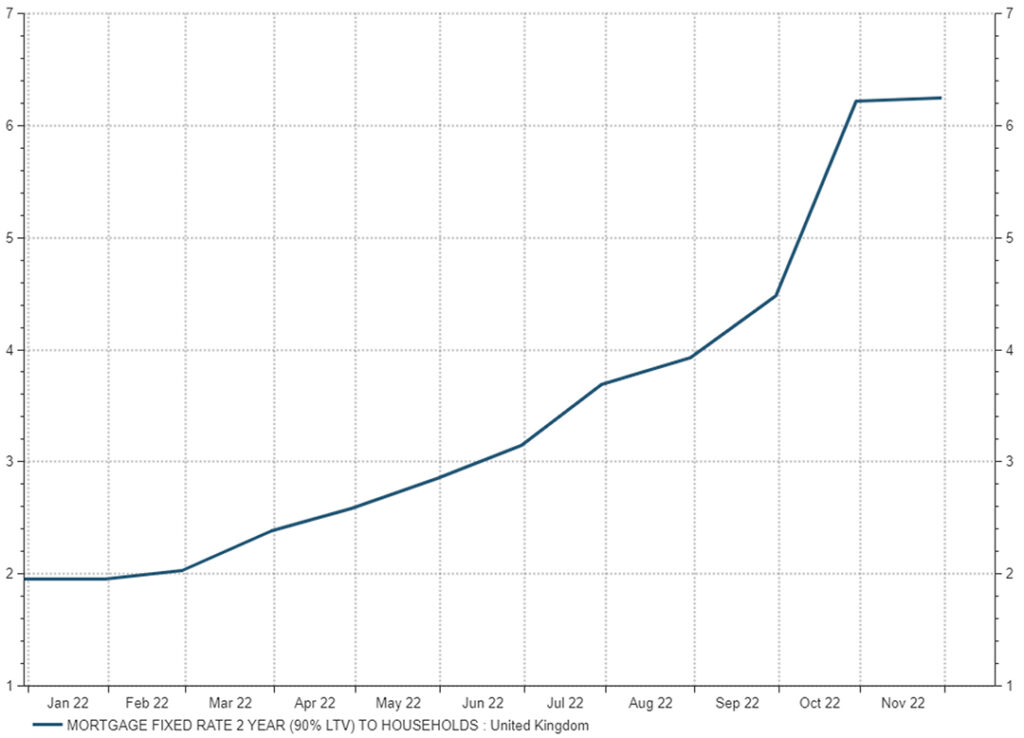
Source: Refinitiv Datastream / Equilibrium Investment Management 2022
In commercial property, borrowing costs (as implied by the 5-year interest rate swap rate) briefly went higher than the typical rental yield. Whilst the borrowing rate dropped again, the gap between the yield and borrowing costs is much lower than it had been. Commercial property prices have fallen as a result.
Commercial property borrowing costs compared to rental yield
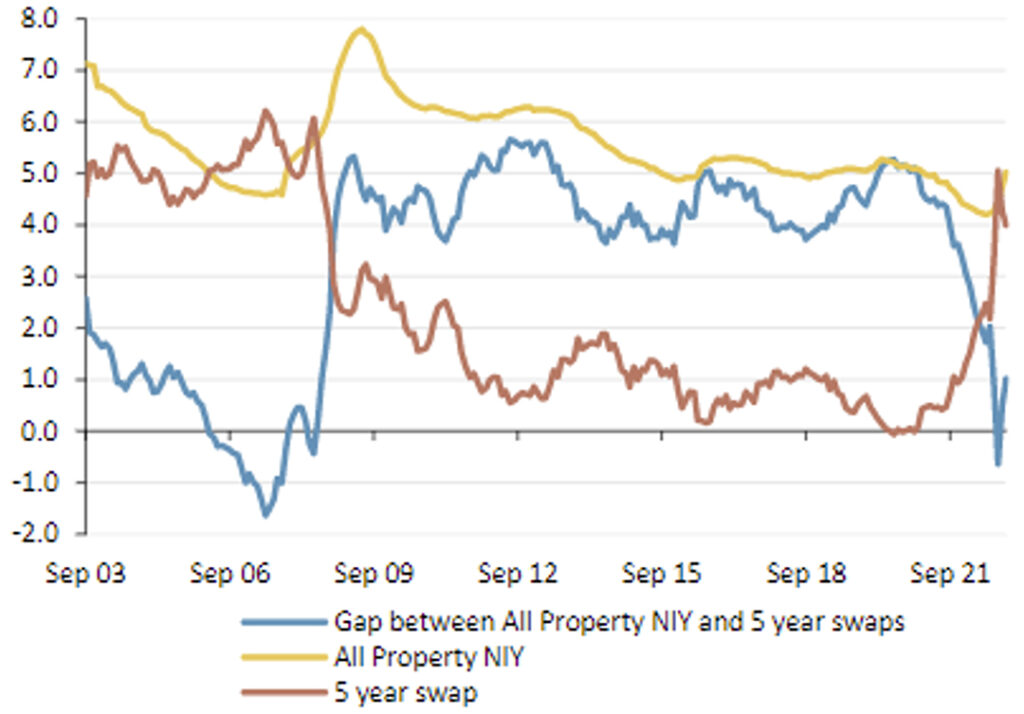
Source: Panmure Gordon, Refinitiv, MSCI 2022
The economy
The PMIs (Purchasing Manager’s Index) for UK, Europe and US peaked in March then steadily fell. These are surveys which give an indication of future economic growth.
Emerging markets were more volatile due to China lockdowns and reopening. However, all the major PMIs are now below the 50 level which indicates a slowing economy:
Composite PMIs – globally
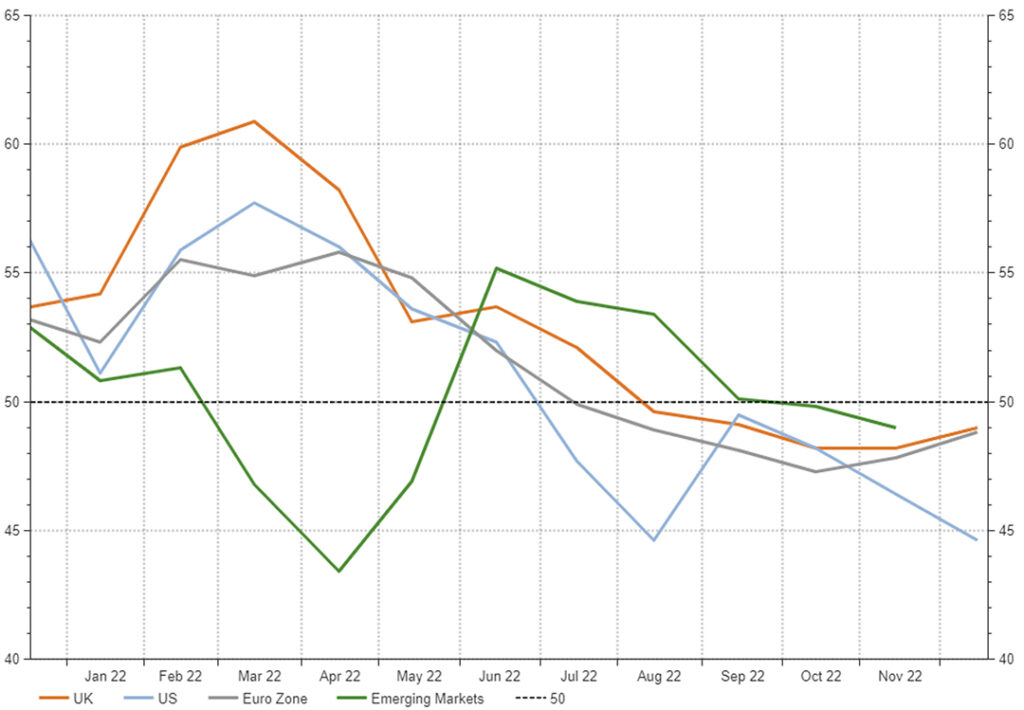
Source: Refinitiv Datastream / Equilibrium Investment Management 2022
This next chart shows the correlation between the PMIs globally and GDP – the current levels imply that the global economy is entering recession:
S&P Global Flash US PMI Composite Output Index
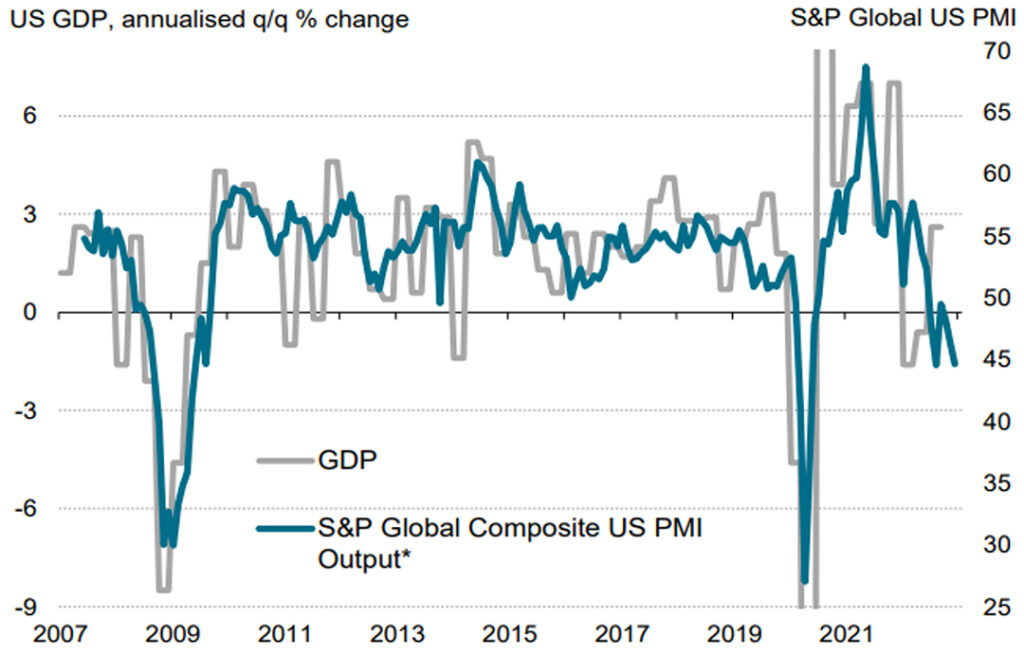
*only manufacturing pre-2009. Source: S&P Global, BEA 2022
In the currency market, the pound fell and the dollar was very strong during 2022. The exchange rate went from $1.35 at the beginning of 2022 to a low of $1.03 (intraday after the mini-budget). It is now back to c.$1.21:
The pound vs the dollar in 2022

Source: Refinitiv Datastream / Equilibrium Investment Management 2022
Markets
It was a terrible year for equities, but in many ways, even worse for bonds.
Each dot on this chart is a different year going back to 1802, the red dot is 2022. Bond returns are along the horizontal axis, equity returns are on the vertical.
In 2022, bonds saw their worst year ever – by a long way.
The chart also illustrates how unusual it is for both bonds and equities to fall at the same time (when the dot is in the bottom left quadrant):
Equity and bond returns – 1802 to date
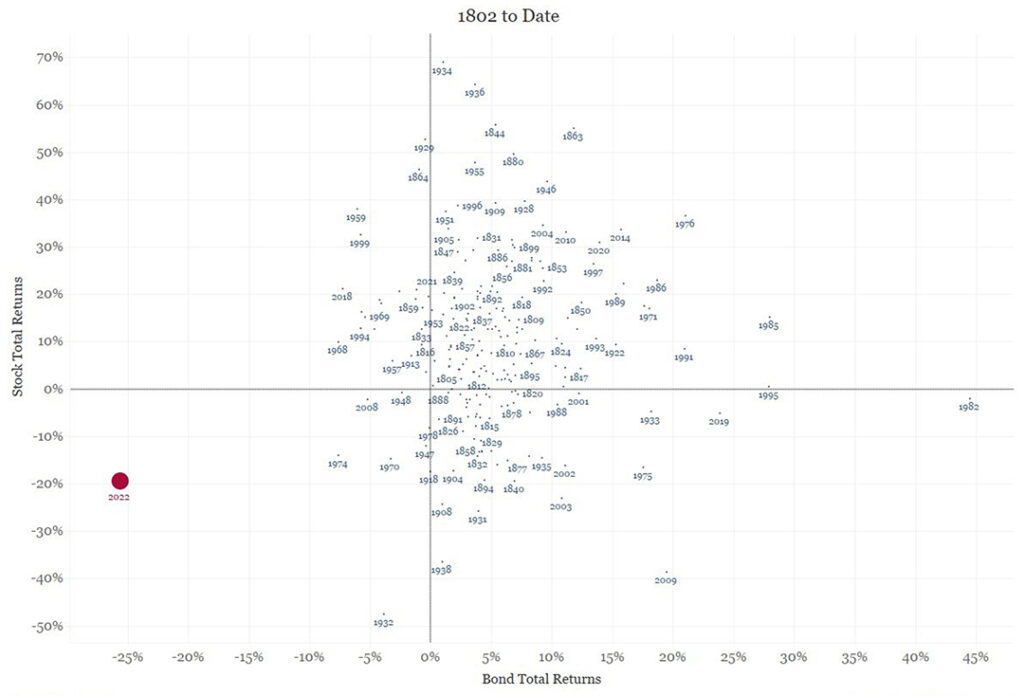
Source: Bianco Research / Edward F. McQuarrie 2022. Based on US markets.
Which means 2022 was one of the worst ever years for a typical 60% equity, 40% bond portfolio:
A terrible year for 60/40 portfolios
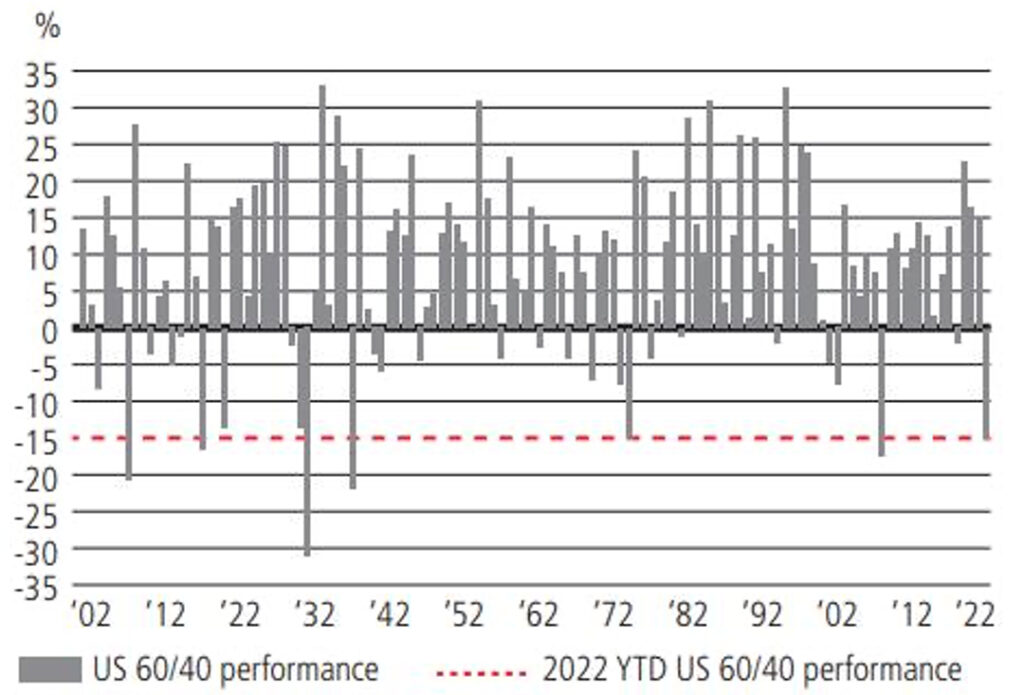
Source: Goldman Sachs Research Division, as of 16 November 2022. Based on performance of S&P 500 and US 10-year Treasury note, rebalanced daily.
In terms of equities, all sectors are down this year except energy – up strongly as a result of higher oil and gas prices – and utilities which was flat:
Equity Sectors in 2022
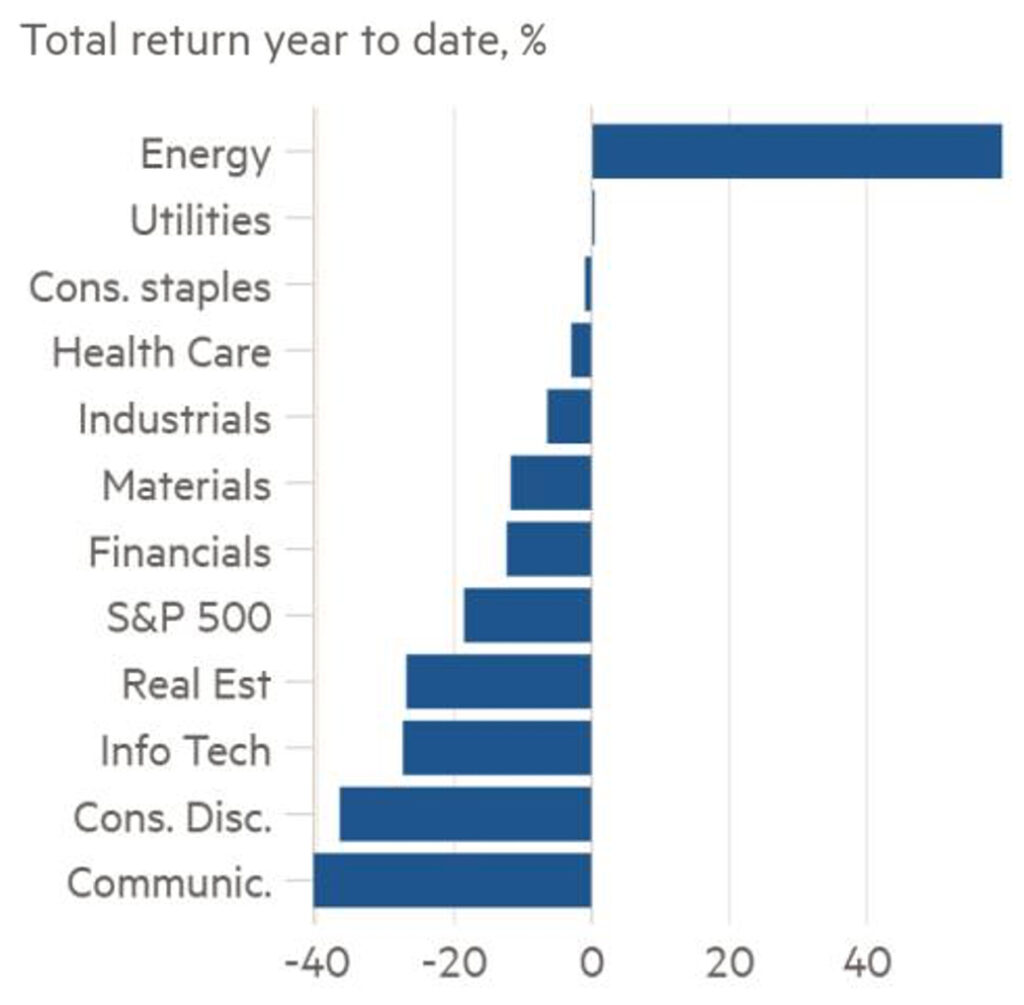
Source FT / Bloomberg 2022
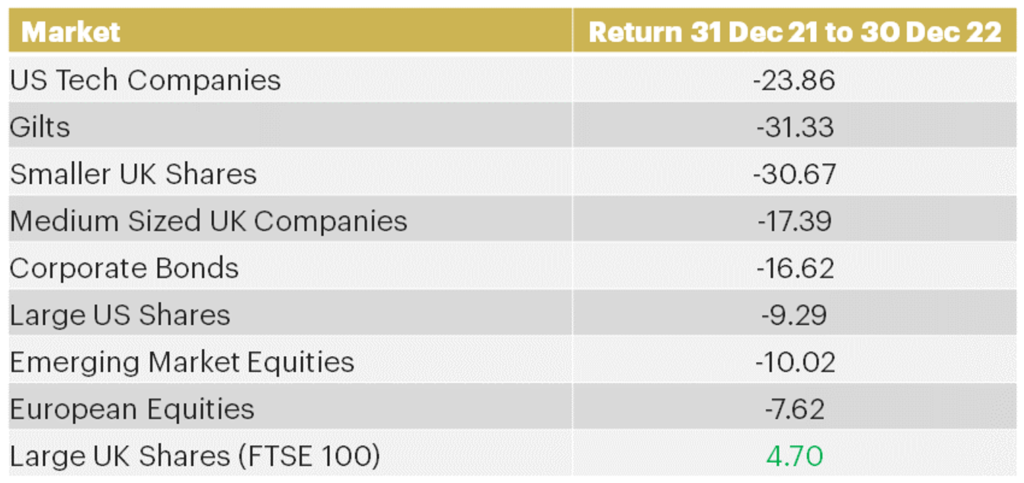
Here are some of the major markets and asset classes in 2022. The only one which went up is the FTSE 100 which is heavy on energy. This is in local currency terms. The Nasdaq index of mainly tech companies was the worst of these markets, but it was only just slightly worse than supposed safe gilts.
Major asset classes in 2022

Source: FE Analytics to 30th Dec 2022, total return in local currency. FTSE AIM Allshare, Nasdaq 100, MSCI Emerging Markets, FTSE actuaries over 5 year FTSE 250, UT Corp Bond, S&P 500, MSCI Europe ex UK, FTSE 100
However, in Sterling terms, the overseas holdings were cushioned by the fall in the pound:
Major asset classes in 2022 – in Sterling
Source: FE Analytics to 30th Dec 2022, total return in local currency. FTSE AIM Allshare, Nasdaq 100, MSCI Emerging Markets, FTSE actuaries over 5 year FTSE 250, UT Corp Bond, S&P 500, MSCI Europe ex UK, FTSE 100
Of our broad asset class portfolios, all were negative except defined returns (see below). Alternatives and infrastructure held up well and even the worst (property) wasn’t as bad as gilts:
Equilibrium asset classes
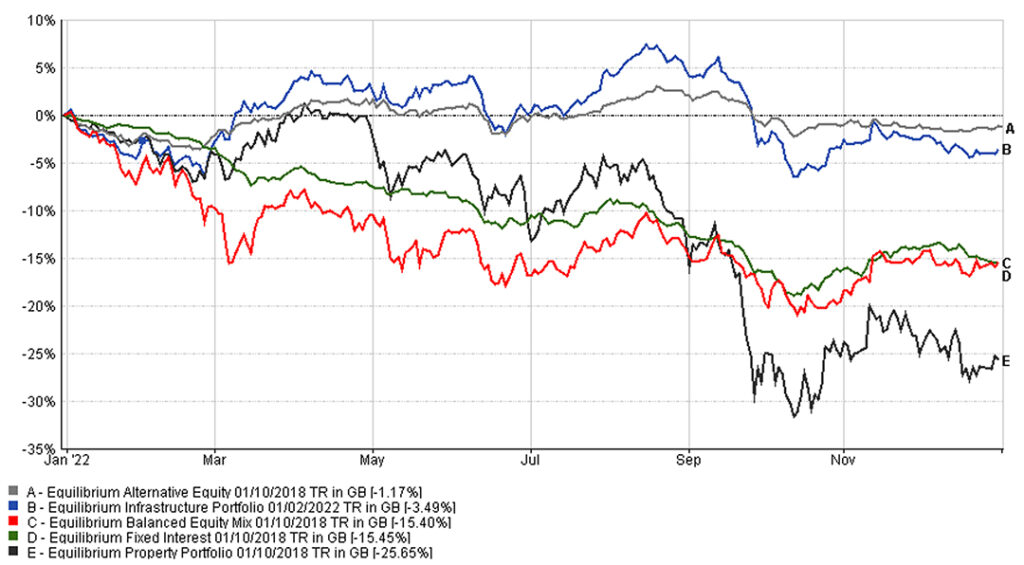
Source: Source: Equilibrium Investment Management / FE Analytics to 2nd January 2023
A big positive was defined returns which mainly produced positive returns in the past year. The standout performer was our Societe Generale product which kicked out in December producing 19% in 2022 (and 47.5% over 5 years):
Societe Generale defined returns kicks out
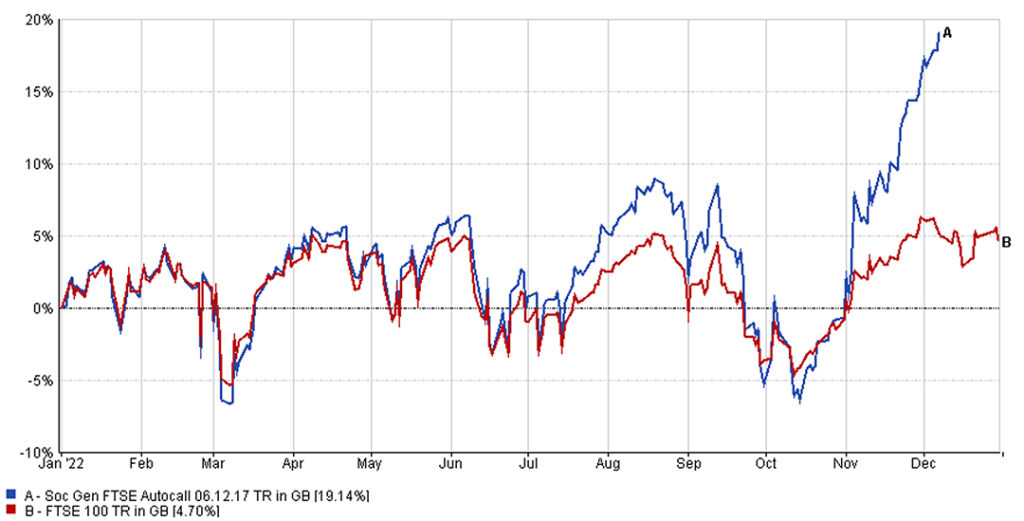
Source: Equilibrium Investment Management / FE Analytics to 30th December 2022
So, what next?
If 2022 was a difficult year, what will 2023 bring?
Unfortunately, we don’t have a crystal ball. However, in our view, many asset classes now look cheap and trade at valuation, where in the past we have seen some very positive returns.
In particular, the table below gives some grounds for optimism. This shows what the stock market has returned in past periods, after it has gone into a bear market (when stocks have fallen 20% or more).
In the past, the next 12 months after a 20% fall have been positive 70% of the time. The median return is 23.8%:
Stocks do well after they go into a bear market
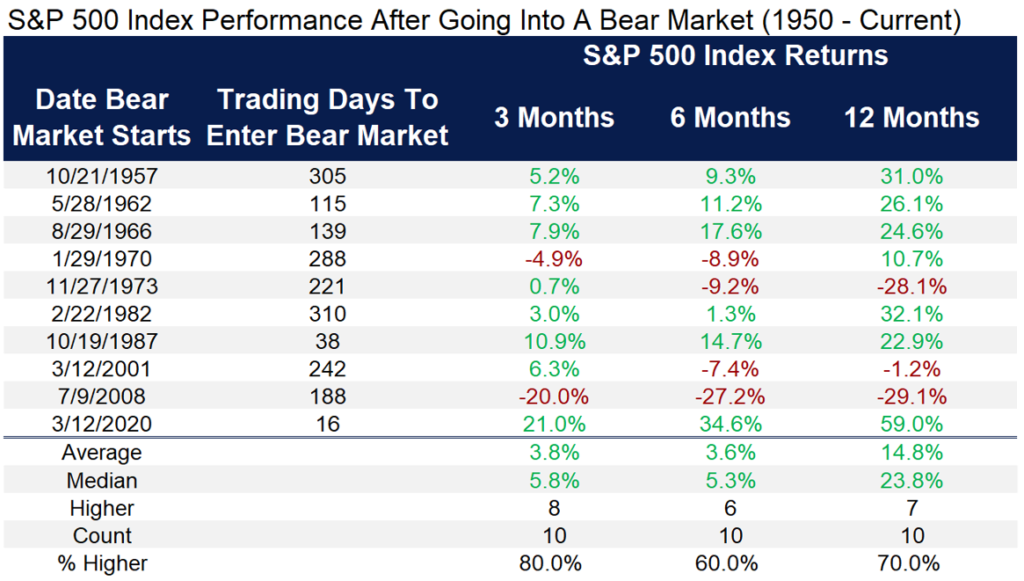
Source: LPL Research, Factset 2022
All indexes are unmanaged and cannot be invested into directly. Past performance is no guarantee of future performance. Performance back to 1950 incorporates the performance of predessor index, the S&P 90.
Past performance is for illustrative purposes only and cannot be guaranteed to apply in the future.
This blog is intended as an information piece and does not constitute a solicitation of investment advice.
If you have any further questions, please don’t hesitate to contact us. If you’re a client you can reach us on 0161 486 2250 or by getting in touch with your usual Equilibrium contact. For all new enquiries please call 0161 383 3335.