Inflation: Knowing about CPI, RPI… and EQI?

With debate and scrutiny surrounding official inflation numbers and how they’re recording, Equilibrium decided to carry out a survey of its clients and how they spend their money. Mike Deverell, of Equilibrium Investment Management, takes a look at the findings.
We often talk to clients about the impact of inflation on their finances.
That said, determining what level of inflation is appropriate is not simple. Some clients prefer to use the traditional Retail Prices Index (RPI) measure, or sometimes RPIX (excluding housing costs).
The official measure of inflation is the Consumer Prices Index (CPI), which is used by the Bank of England targets when setting monetary policy. They are meant to target CPI inflation of 2% pa over the long term, which is why we tend to use this figure as our long-term inflation assumption.
So, how is CPI calculated? The Office of National Statistics says it is based on the price of a typical basket of goods bought by the average person. However, nobody is average! To illustrate this, the basket currently includes goods such as ‘animal cage’ and ‘action cameras’ (Go-Pros to you and me). In reality, everybody’s level of inflation is different depending on what they personally spend their money on.
Therefore, we recently decided to survey our clients to find out where they spend their income and whether this is different to the population as a whole. This would give us an EQI (the Equilibrium rate of inflation).
However, it’s important to note that this proved a more challenging exercise than we originally realised. To start with, it is very difficult and time consuming for people to work out accurately where they spend their money and we’re very grateful to those who took the time to respond.
There was also a great deal of data clean up required with responses being received in both pounds and percentages. In hindsight, some of the questions were more ambiguous than we’d have liked and so we’ve had to interpret some of the answers as best we could. It is also important to remember the average age of our respondents was 65, as many of our clients are retired and a relatively wealthy. This is an obvious skew from the rest of the population.
The results are therefore only indicative. However, there are some interesting points, some of which we’d expected but some we certainly didn’t!
Due to the fact many of our respondents are retired, we found our clients tended to spend more on housing related costs and less on transport, this is something that we had anticipated.
Table 1 shows the results and the average level of inflation for each category over the ten years to 2017:
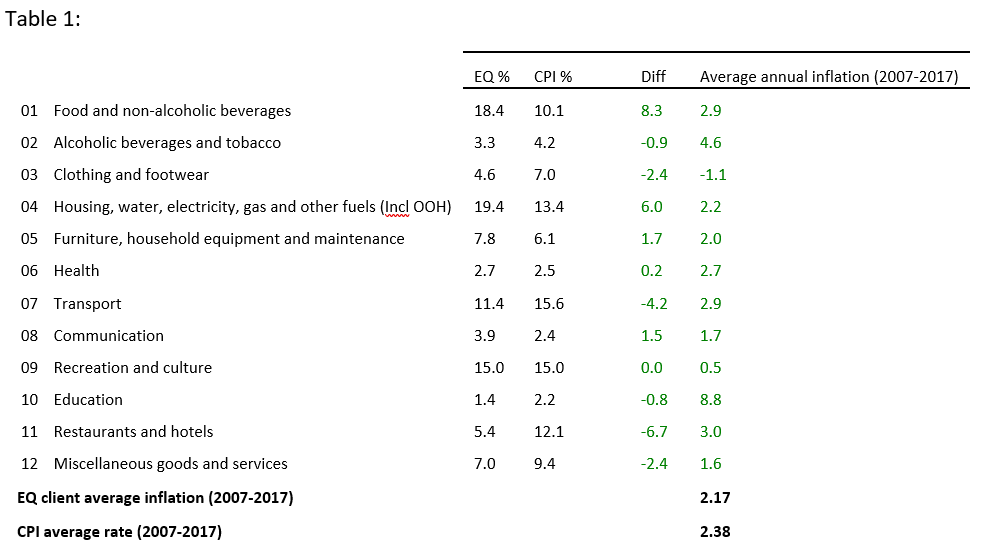
Overall, our clients’ rate of inflation was slightly below CPI over this period, averaging 2.17% compared to 2.38%.
Looking back, the highest individual year of inflation was 2010 when our clients would have experienced a 3.9% increase in prices. However, that year CPI was even higher at 4.5%, driven by an 8% increase in transport costs.
The lowest year of inflation for our clients was in 2015 when they’d have experienced mild deflation (-0.1%) whilst CPI was flat.
Looking to the different areas of expense there are certain things we can take away from this survey. According to the CPI the three highest areas of inflation over the decade to 2017 were alcohol and tobacco, transport, and education – all of which our clients spent less on than the average.
The other big difference in spending compared to CPI is in how much our clients spent on restaurant/hotel bills. Here, the EQ rate of inflation was 5.4% compared to CPI of 12.1%. This is perhaps surprising given the relative wealth and (in some cases) greater amount of leisure time that some clients have compared to the population as a whole.
There was also a differential between alcohol and tobacco consumption – with the EQ rate of 3.3% compared to CPI of 4.2%. This could lead us to the conclusion that our clients are a clean living, frugal lot; or perhaps, because they have higher than average incomes then the proportionate spend is less.
A number of our clients have told us over the years that they feel the official inflation statistics understate the true picture. Perhaps those individuals do spend more on areas with steeper price increases, or perhaps it is partly a matter of perception. After all, CPI tends to be lower than RPI but RPI has been around for much longer and so perhaps has more “credibility” as a result.
If this is true, then RPI certainly doesn’t deserve this reputation! RPI is considered an outdated and flawed calculation which does not give a true picture. For example, according to the RPI calculation, women’s vest tops increased by 400% from 2010 to 2017. The actual change in price was around 20%!
Whilst the results of our survey are only indicative, on the face of it our clients don’t appear to have a higher than average rate of inflation. On the contrary, if anything it appears to be slightly lower.
If you are interested in discussing how your expenses may be influencing your broader financial plans or would like to learn more about the impact of inflation generally, please get in touch with your Equilibrium contact.
Disclaimer: The content contained in this blog represents the opinions of Equilibrium Investment Management. The commentary in this blog in no way constitutes a solicitation of investment advice. It should not be relied upon in making investment decisions and is intended solely for the entertainment of the reader.