Back to School

Summer may have been a washout for the UK but for global equity markets it has been a case of high and dry. In this blog, Graeme Black discusses how to analyse these movements and what they might mean for the investment world.
Summer’s end
Summer may have been a washout for the UK (the seventh wettest summer since 1910) but for global equity markets it has been a case of high and dry.
Despite a pull back at the beginning of August, global equity markets have continued to advance, paying little heed to the adage recommending investors to sell in May… or the concerns reflected in bond markets.
Any parent (and I’m sure grandparent too!) will tell you September is a pretty hectic month – the summer weeks of juggling work, holidays and additional childcare finally end and the hopes of getting back to a normal routine start to become a reality.
Investors too have had a pretty hectic few months. Economic figures haven’t given too much reason for concern and central banks seem to be tuning up to start the music playing once again. But then the threat of a misplaced tweet or blow-up in trade/Brexit talks is leaving investors less than certain.
Sometimes when things get confusing it’s best to take it back to basics, attempt to remove the noise, and remind ourselves what we are investing in and why.
Back to school!
Holding shares in a company gives the holder a part ownership in that company and a stake in all future earnings. We know that companies don’t pay shareholders all the earnings they make; Whilst some can be shared as dividends, earnings are often held back to be reinvested in the company to enable further growth of future earnings.
We often refer to ratios like price to earnings (PE ratio) or price to book (PB ratio) when talking about equity markets. Some of the fund managers we invest with will use these ratios alongside others to determine how cheap or expensive a share may be and how attractive it may be for inclusion in their fund.
Using PE as an example, if we divide the share price by earnings per share we can understand how long it may take to recover the cost of the shares using the derived earnings. Our PE example tends to be in one of two forms; trailing PE uses earnings from the past 12 months whilst forward PE uses earnings that are expected in the next 12 months.
This is all good and well but as part owners and long-term investors we are also interested earnings that are made beyond the next twelve months.
Further education
One approach is to use a discounted cash flow (DCF) model. This type of analysis will look to value a company based on projections of future cash flows (earnings) of the company discounted back to today’s value.
The first step is to estimate what earnings are expected for the company over the coming years – different managers may go further out into the future but this becomes more and more difficult to calculate and accuracy will fall. We have seen from analyst revisions to earnings expectations that estimates can change over one year, never mind over multiple years.
The next step is to convert future cash flows into today’s terms using an appropriate “discount rate”. The discount factor is usually influenced by the risk-free rate of interest, the company’s cost of capital and potential risks to its share prices. The risk-free rate can be thought of as the yield on US or UK government bonds (treasuries or gilts) which are very low compared to historic levels. The cost of capital for companies is also low, which suggests a discount factor should be relatively low too!
For those who are interested in the maths of it, we can find the present value of future cash flows or earnings using the below formula where CF is the cash flow, DF is the discount factor and n is the number of years away the cash flow is:
![]()
Finally, the sum of all future earnings discounted back to a present value will reflect the implied value of the shares. This value can be compared to actual share price to determine whether the shares represent good value or not.
Placement
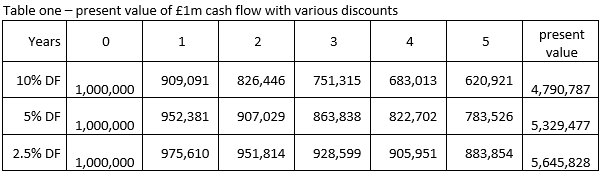
Table one, below, shows us the present value of £1m cash flow using various discount factors.
The higher the discount factor the more future earnings are eroded in today’s terms meaning the lower the discount value the greater the present value of future earnings will be.
Investors will pay more as the present value of future earnings increases!
Graduation
Now we understand the theory, let’s see how this plays out in the real world.
The below forward PE chart breaks the US stock market into five groups based on long-term earnings growth estimates. The high growth line is the top 20% of companies, fourth quintile the next 20% and so on.
It’s unsurprising that investors are willing to pay more for companies with greater expected earnings growth. However, chart one shows growth has never been at such a premium and we can also see greater dispersion between the quintile groups – but we have also arguably never had such low discount rates!
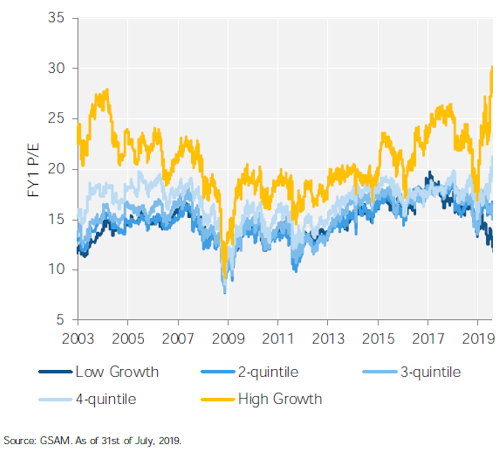
Chart one – PE chart showing US stock market based on long-term earnings growth estimates
Chart two shows the relative performance of the MSCI World Growth and Quality equity indices compared to the MSCI Value index – consider this comparison of high and sustainable earnings growth compared to low earnings growth but at lower multiples. We can see the effect of the tech bubble at the turn of the century where many companies, including the likes of Apple and Amazon, traded up to astronomical levels before selling off during the crash.
During the crash, unsurprisingly, the high growth names that had done so well then underperformed and the value (low growth but cheap) index outperformed through to 2007/08 and the great financial crisis. In answer, central banks slashed interest rates and introduced massive amounts of liquidity by way of quantitative easing.
In doing so, the discount factor, which if we recall “is influenced by the risk-free rate of interest, the company’s cost of capital”, fell significantly.
Lower discount rates will boost all valuations as future earnings are discounted by less – however, not all companies will have the same earnings projections, those companies with greater future earnings growth potential stand to benefit even more.
This has arguably been a major factor in the rise of growth and quality.
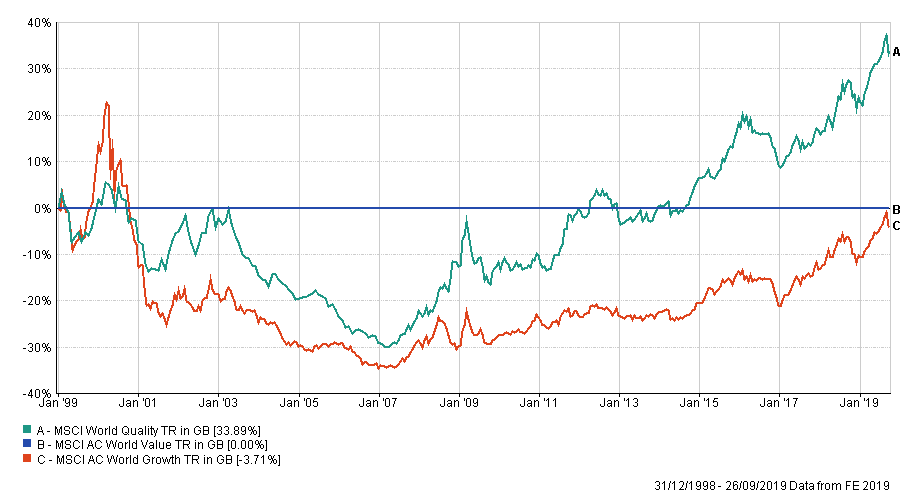
Chart two – relative performance of the MSCI World Growth and Quality equity indices compared to the MSCI Value index
Never stop learning
Central Banks are loosening monetary policy and, whether this is a mid-cycle adjustment or something more permanent, we would appear to be in a lower for longer interest rate environment.
This would suggest equity markets can continue to advance and the growth over value relationship will continue course. Having said this, we occasionally get a reminder that this may not be a one-way road and that market corrections and style rotations can be sharp and severe. This could especially be the case if the current market expectations for further rate cuts are not met.
The investment world never stands still. Without adjusting assumptions and views it can be very easy to miss out on returns or find yourself on the wrong end of a sector/style rotation.
We therefore always assess our equity portfolio’s underlying holdings, looking at the sector and style exposure to make sure we have a good understanding of where the true risk to returns lie.
The content contained in this blog represents the opinions of Equilibrium Investment
Management LLP. The commentary in this blog in no way constitutes a solicitation of investment advice. It should not be relied upon in making investment decisions and is intended solely for the entertainment of the reader. You should be aware that the value of an investment can go down as well as up, and no guarantees as to the future performance.