Under the bonnet: The EQ Equity Portfolio
We are often asked by our clients to provide more detailed views of our portfolio and to share our thoughts on what we look for when constructing portfolios. We have a number of tools at our disposal that allow us to look beyond the high level fund selection. We are able to see how the funds, and our portfolios, look underneath at the stock level.
Our Balanced and Adventurous Equity Portfolios are constructed using a blend of five sub-portfolios; UK Conservative, UK Dynamic, UK All, Global Established and Global Speculative. Below, Table One sets out the performance of each of the sub equity portfolios that make up the Balanced and Adventurous Equity Portfolios. This table highlights just how difficult it has been investing in equity markets over the past year. We can see just how big an impact October had – basically wiping out returns made in the recovery experienced in April.
For this blog, I’m looking at our UK equity portfolios. We have three UK equity portfolios but, due to a current preference for active management, I’m going to focus on our Conservative and Dynamic portfolios where funds are picked to achieve specific expected return characteristics.
Conservative
As the name suggests, this portfolio aims to be more robust and contains funds that tend to have greater exposure to defensive sectors and established companies with higher dividends (rather than smaller or mid cap companies using all or most of their earnings to grow the business).
This lower risk appetite means the portfolio should hold up well in market sell offs but may underperform if equity markets advance rapidly.
Dynamic
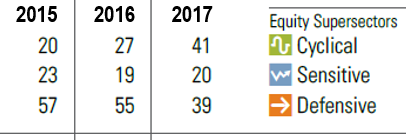
The nature of underlying equities in the dynamic portfolio is very different. Here, the portfolio has a higher growth focus, the funds exposed to more growth oriented and cyclical sectors. Unlike in the conservative portfolio, these companies are often less established and valuation metrics such as price to earnings (the price of a share divided by the earnings per share) tend to be higher as investors are paying now for expected future earnings.
Over the long term we expect this portfolio to outperform. However, with the greater level of risk that comes with less mature companies, this can come at the cost of higher volatility and short-term underperformance.
Allocation
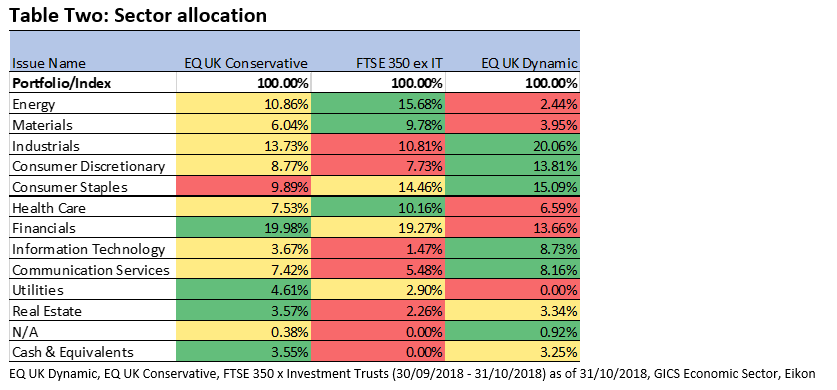
Table Two shows us the sector allocation of these portfolios, comparing this with the FTSE 350 ex investment trust index. The table is coloured to show the portfolio with the greatest (green) down to least (red) exposure to a sector.
Through active management, both portfolios are underweight in energy and materials compared to the index. We can also see the conservative portfolio has a greater weighting towards financials, utilities and real estate – arguably slower and steadier sectors – and the dynamic sector has more in higher growth sectors. These, such as consumer services and tech, are linked to how well the economy is doing and how much consumers are therefore willing to spend. These are the kinds of names that suffer in times of turmoil (when people are more likely to rein in their expenses)
Sector Returns
Very interesting, I’m sure you’re thinking, but how well has this actually done?
Table Three goes further and looks at each sector within the portfolios and index as a standalone portfolio. The table is coloured to show sector portfolio returns with greatest (green) down to least (red) through October.
Clearly, sector portfolios in UK Conservative have outperformed in most sectors compared to the index and the UK Dynamic portfolio. Conversely, we can also observe the underperformance over the month in UK Dynamic sector portfolios. This is a good example of where our Dynamic portfolio is taking more risk than our Conservative portfolio – and paying for it!
Long Term Investors
I’ve mentioned this before in previous blogs, but our favour lies with small cap equities where decent earnings growth has not been rewarded and stocks have been rerated downwards. This means that you pay less for earnings in these companies.
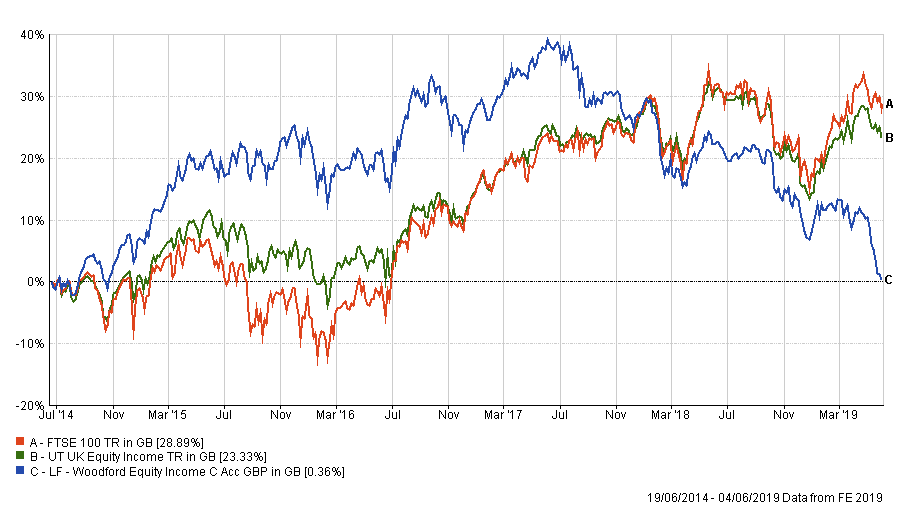
Below, Chart One shows the long term returns of the portfolios and FTSE ex IT index. The UK Dynamic portfolio, which takes on more risk, has outperformed the UK Conservative Portfolio which has chugged along in a very similar way to the index.
However, the flipside of this can be seen at the end of graph. See that sharp dive in the blue line? Notice how the red line has not dipped as much? This roughly shows the relationship between taking on more risk to gain greater returns, showing that this can do investors a disservice in market downturns.
Portfolio Construction
Whilst we never hope for any of our portfolios to underperform, we must concentrate on long term returns while at the same time managing shorter term bouts of volatility.
It can be difficult to foresee what the market will do by the end of the day, let alone by the end of the year, and this this is before you factor the levels of uncertainty Brexit adds to the equation. We would be naïve to think we could call the result of the market.
However, what we can do is position our portfolios to limit short term losses and try and avoid permanent loss for our clients. Done right, this can give us the ammunition to be flexible and take advantage of opportunities that present themselves and sometimes this can come down to rotating from one portfolio style into another.
Disclaimer: The content contained in this blog represents the opinions of Equilibrium Investment Management. The value of your investments can fall as well as rise and are not guaranteed. Investors may not get back the amount originally invested. The commentary in this blog in no way constitutes a solicitation of investment advice. It should not be relied upon in making investment decisions and is intended solely for the entertainment of the reader.
Definitions
Active management: The use of a fund manager, or team of professionals, to make investment decisions and create a portfolio artificially. This means they will actively try and be different to what the portfolio looks like, aiming to create returns from this. falling.
Cyclical sectors: The name given to companies that do well when the economy is strong and growing. Tech could be an example of this – people are more likely to buy flatscreen TVs and smartphones when the economy is doing well and they have more money to spend.