Market briefing 18th March 2020
It is amazing how quickly we have moved from the “Boris bounce” to one of the fastest stock market sell-offs in history!
This is of course not a normal downturn. This is not a correction caused by a recession, or even by a financial shock to the system, although both of those are happening. This is also a shock to our way of life.
What we’ve been worried about is that this may mean that some of the normal rules in a market fall don’t necessarily apply. The difficulty has been in working out which investment rules still apply and which don’t. The types of companies which normally do well in a recession may not be the ones which do so in this one.
What about government bonds, which tend to move in the opposite direction to equities? When people are worried about stocks, they seek the safe haven of a bond guaranteed by a nation state. For the last couple of months, we’ve been glad of such holdings in portfolios which have been going up even whilst stock markets have dropped.
Last week, everything changed. Things that are not normally correlated became correlated.
The things that usually fall less in the market downturn, fell harder and faster. In fact, pretty much everything fell last week, even the supposed safe havens of government bonds and gold.
What we’ve seen over the past week or so are signs of financial stress, with demand for cash (especially dollars) becoming elevated and investors liquidating positions. We ourselves sold down a significant portfolio of our non-equity assets, with cash levels for a cautious portfolio now standing at around 20% of the fund value. Balanced portfolios currently hold around 14% cash and adventurous around 7%. We plan to increase this even further.
Our strategy has been to increase the safety of the non-equity assets to give some balance to the increased risk in stock markets. Other investors have been of the similar mindset. In fact, some have been forced sellers, requiring cash to meet margin calls on leveraged positions (essentially they need to pay down debt, fast!).
Even in a low risk asset, if everyone is selling then the price is going to go down.
However, it was stock markets of course which took the brunt of the falls. Table one below shows the top 10 worst ever days for the FTSE 100. 12 March 2020 was the second worst ever. 9 March 2020 also makes the list. This has been the fastest fall into a bear market in history, defined as a 20% fall from the recent peak.
Table one:
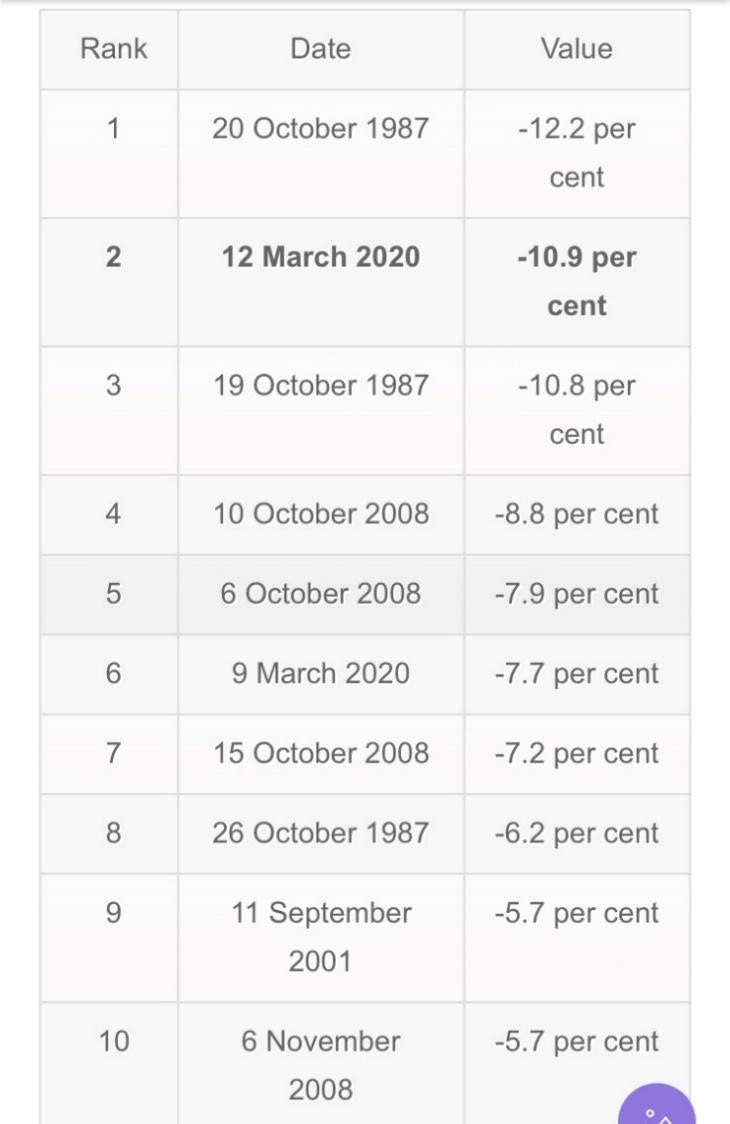
Source: Refinitiv
So what next?
We are clearly about to experience a recession.
We still don’t know how long or how deep, but there could well be significant numbers of companies going out of business without government intervention.
The big question is whether this will turn into a financial crisis. The Federal Reserve has just cut interest rates by a full 1% over the weekend. It is also providing vast amounts of funding via (essentially) quantitative easing. It is also allowing banks to eat into their capital.
By doing so, the Fed has sent out a signal that they ARE worried that this could become a “liquidity crunch”, and so investors have reacted negatively to this action.
What the Fed (and other central banks including the Bank of England) is trying to make sure of is that the “plumbing” of the financial system continues to function. They don’t want companies folding because there isn’t enough liquidity out there.
This action is positive and should help put a floor under assets, even if it is also confirmation that things are pretty bad out there. However, central banks can’t cure a virus and neither can governments, although financial support for businesses will help.
However, until we see some signs that the virus is getting under control then markets can’t recover. It may be that a market recovery can’t happen until we reach the point where large numbers of people are told to stay home in the UK and America, as they have been already in much of Europe.
What has and hasn’t worked in portfolios?
Clearly, knowing what we know now, there are loads of things we wish we’d done differently!
Unfortunately, we can’t predict the future. However, what we can say is that to date most of the assets we’ve invested in have acted as we would expect in a downturn. Our equity portfolios have all fallen less than the FTSE 100 over this period (source: FE Analytics to 16 March). We also came into this period holding less traditional equity than usual.
Our fixed interest and property, and lower risk alternative equity funds have held up well.
What hasn’t worked is defined returns.
Normally, when markets fall our defined returns products drop by less than the market. That is because these products don’t require stock markets to increase over the life of these products, they just require them to not fall. As such, they are usually seen as a lower risk way of playing the stock market.
Over the last week or so they have fallen by more than the market.
Our worst performing investment in the recent period is our Credit Suisse product, set up on 30 January 2018 when the FTSE was at 7,588 and the S&P 500 at 2,822. It will pay a rate of 10.8% pa should these markets close at or above these levels on any of the first six anniversary dates.
If these markets have not gone back above these levels during the full six-year term, investors just get their money back unless one or both markets are at least 40% down on that date. We then get the return of the lowest performing index. For example, if the FTSE had dropped 41%, we would lose 41%.
This ‘barrier’ level is 4,553 on the FTSE. This morning, as the market fell below 5,000 the price of the product, had we sold it, was £0.66 per share.
In all our backtesting, no six-year period in history has seen the market fall by 40% or more. That doesn’t mean it can’t in the future of course, but shows how unlikely a scenario it is.
As long as the FTSE closes above 4,553 on 30 January 2024 then it will be worth £1 per share. That’s a 51% potential upside even if the market drops 500 points over just under four years! If we don’t get back above 7,588 until 2024 but do close above it on that date, the product will be £1.648 per share, which is a possible gain of nearly 250%!
There are several reasons the secondary pricing has become so bad. The first is the proximity to barrier levels, although we are a long way away in terms of time. The other factors are levels of volatility, and the signs of financial stress hitting the credit of banks. The other factor we need for this product to provide a return is that Credit Suisse still needs to be solvent.
These products, therefore, have an intrinsic value greater than their current pricing, before we even consider the potential gains.
What value is there in markets?
Just as the intrinsic value of defined returns is significantly higher than here, we also believe the same of the stock market.
Not every company will go out of business. Some may even profit from the misfortunes of others. However, we do expect profits to be significantly lower overall in the short term, even if they may recover later.
As of close on 16 March, the UK stock market traded on 12.2 x the latest earnings of companies.
In the past, when the PE on the UK market has been at current levels we have tended to see some good returns over the following five years.
Chart one shows the relationship between PE and returns. Each dot on the chart shows a different five-year period in the UK stock market. The higher up the chart, the higher the return was over that period.
Along the horizontal axis is what the PE on the market was at the start of that five years. I have circled in blue the periods when the PE was similar to what it is now.
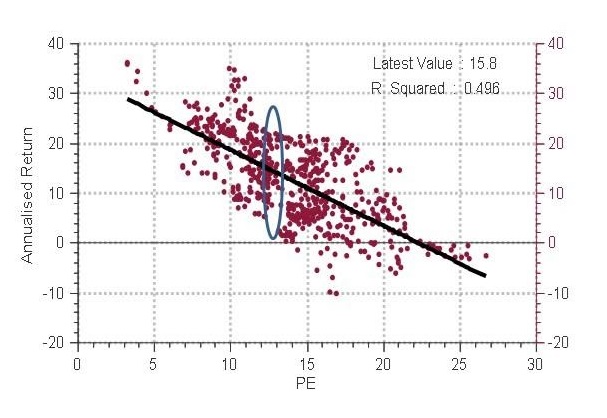
Source: Refinitiv / Equilibrium Investment Management
All of the dots in this circle are well above zero and most are above 10% per annum.
Whilst this is only historic data, it does give us some reassurance about the future.
In the history of this data, we have only quite rarely seen the PE ratio drop below 10. Only in the Eurozone debt crisis, the financial crisis, and in the 1970s / early 80s have we seen the PE drop below 10.
Whilst in the short term we don’t know which way markets can go, if we can take a longer-term view there are good reasons to believe that returns will be positive.
But what about earnings?
You might quite reasonably point out that earnings (profits) are likely to take a big hit, so what is the right PE ratio to look at?
This is quite correct but provided companies do not become insolvent, then the hit will be temporary.
Imagine a small company that makes £1m per annum profits and has no debt. If we assume it is valued on a PE of 15 then it is worth £15m.
What if that company makes no profits at all this year but in fact makes a £1m loss and ends up with £1m of debt?
Assuming it remains solvent and goes back to making £1m once this is all over, it is now still worth 15 x profits, so still worth £15m, les £1m of debt.
That is ignoring any future growth in profits. Often, after a downturn profits in fact bounce back strongly.
The trick then is to make sure companies stay solvent in the meantime. In France, President Macron has announced that “no business whatever its size will face the risk of bankruptcy”.
We have just had similar action from the UK government who have pledged £330bn of loan guarantees which amount to 15% of our GDP. There are also some grants and temporary tax cuts for businesses.
Whether this is enough to halt the falls in markets remains to be seen. We need to see similar actions by the American government in order for this to happen. At the time of writing, the US appears to be doing a lot of “considering” and “discussing” big financial packages rather than actually doing it.
The content contained on this webpage represents the opinions of Equilibrium Investment Management and in no way constitutes a solicitation of investment advice. It should not be relied upon in making investment decisions and is intended solely for the entertainment of the reader. Past performance is not a guide to future returns. The value of your investments can fall as well as rise and are not guaranteed. Investors may not get back the amount originally invested.