A brighter forecast?
Executive summary
- There has been a recent trend where economic data has been “less bad” than many people had expected.
- There are signs of inflation moderating, with energy prices down significantly from their peaks in 2022. This has been helped by the mild winter in North West Europe, reducing demand for natural gas.
- If this continues, then perhaps the economy could do better than expected.
- Short-term investment forecasts are usually wrong because the short term is driven by unpredictable events (like the weather!). However, over the long-term, valuations of various asset classes tend to explain much of their returns.
- Right now, certain assets look cheap compared to history, at levels where we’ve historically seen good long-term returns.
- This is especially true of smaller companies, both in the UK and the US. These tend to be quite economically sensitive and can underperform when the economy is poor. However, should the economy do “less bad” than expected, then we think they could do very well and have increased exposure.
The trouble with forecasts
At this time of year, investment banks like to release their market forecasts for the year ahead.
Whilst these can sometimes be an interesting read, in truth most of these forecasts are not worth the paper they’re written on. This is because every year (every day) there are many events that were not even considered when the banks made their forecasts.
For example, Wall Street forecasts for 2020 failed to take into account the Covid-19 pandemic. In their 2022 forecasts, they failed to account for the Russian invasion of Ukraine and the effect this would have on inflation.
No doubt this year will throw up many surprises too, hopefully some good ones this time!
In fact, conceivably the outlook for 2023 could even be affected by the weather.
Gaining energy
One of the main drivers of last year’s falls in both equity and bond markets was inflation. The rise in the price of essentials has caused a downturn in the economy as we all have to spend more of our money on things like food and bills.
Higher inflation meant that central banks were forced to put up interest rates more quickly than they had planned, which has also affected many asset classes.
Recently, we have seen some better news on inflation – and it’s mainly to do with the weather.
Much of the rise in prices is directly or indirectly linked to the price of energy.
Given the rise in your bills, you may be surprised to learn that wholesale natural gas prices are now about 17% BELOW where they were one year ago. (Source: Trading Economics, 9 Jan 2022 to 9 Jan 2023)
This is based on the so-called “spot price” (gas for immediate delivery) in the wholesale market. This is what a utility company might pay to buy the gas they then sell on to consumers.
However, our energy bills are much more dependent on the so-called “forward price” than the spot price. Utility firms tend to hedge their exposure to volatile prices by buying their gas in advance.
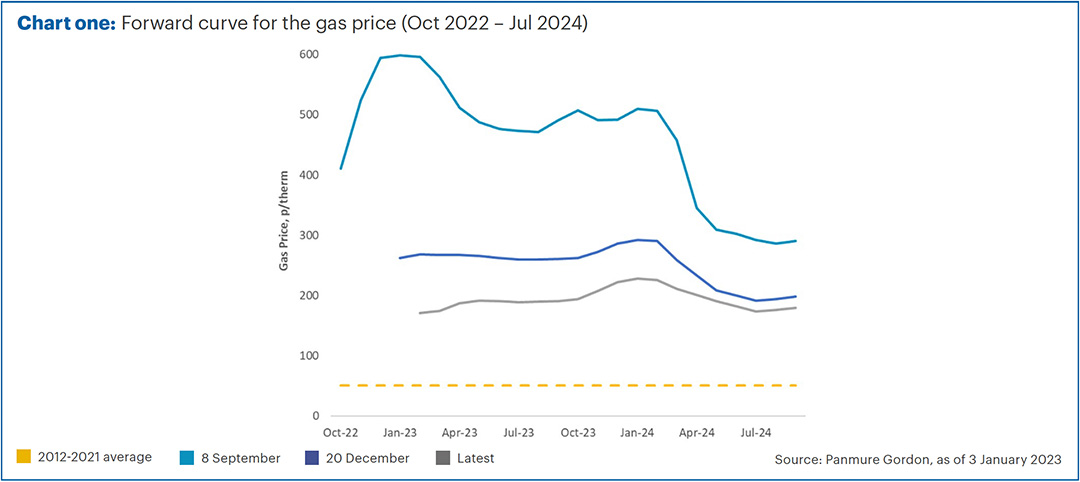
Chart one shows the current “forward curve” (grey line) for the gas price compared to what it was in September (light blue) when the government announced their energy support.

Back in September, the expected price of natural gas for January 2023 was expected to be around £6 per therm. In fact, it is less than £2 per therm.
If you want to buy gas now for delivery in January 2024, it will cost just over £2 per therm, compared to circa £5 per therm which it would have cost back in September.
Of course, utility firms may have already bought some of their gas at older, higher prices and therefore it will take some time for our bills to come down.
Additionally, in the short term, any savings will be made by the government rather than us – it will cost them less to subsidise our bills than expected – but it does mean that bills are less likely to increase so much when government support reduces or ends.
So why have gas prices come down so much?
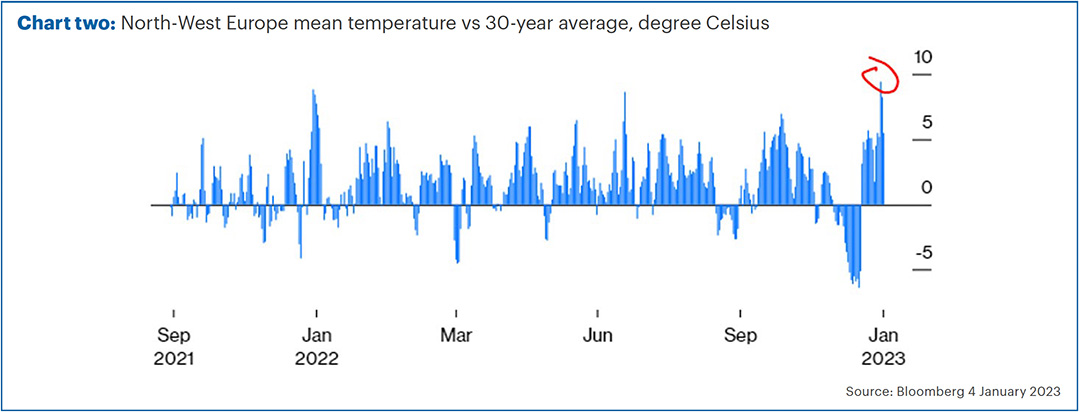
The main reason, as chart two shows, is that this has been a relatively mild winter in North-West Europe. This means demand for gas has been much less than expected.

Better than expected
As well as a mild winter (so far), European countries have also done much better than expected at switching away from their reliance on Russian gas. Gas storage facilities are relatively full as a result, giving Europe a cushion against further cold snaps.
The positive developments in energy markets are part of a recent pattern, where data has been deemed “better than expected” in the short term.
For example, many of the recent inflation figures in the UK, US and Europe have been lower than had been expected by forecasters, and many of these inflation measures are now beginning to come down. As well as lower energy prices, some goods prices have started to fall.
Slower inflation doesn’t mean prices have fallen. It doesn’t mean that inflation is not still uncomfortably high, just that the rate of recent price rises has softened compared to what was expected by economists.
Despite some of the doom and gloom forecasts for a steep recession, we have also seen some slightly better economic data of late.
For example, the latest UK economic growth numbers have been much better than expected. Although the economy marginally contracted in the 3rd quarter of last year, there was a much stronger than expected rebound in October (after the Queen’s funeral in September) and November’s figures were also unexpectedly positive. This means the 4th quarter looks likely to be a positive quarter for growth and therefore we are probably not in recession as many had forecast (a recession is usually defined as two negative quarters in a row).
For a more up-to-date idea of how the economy is doing, we like to look at business surveys such as the S&P Global Purchase Manager’s Index (PMI). In the UK, Europe and emerging markets, these surveys were all less negative in December than they had been in November.
Again, we’re not saying everything is fine and there’s nothing to worry about, just that there has been a recent trend for such data to be less bad.
Should the weather and other external factors remain kind to us, it is plausible that the economy may prove much more robust than the worst fears. If so, we think this could help markets to recover.
Short-term vs long-term forecasting
Meteorologists have a much better track record than Wall Street forecasters, but only in the relatively short term.
Short-term weather forecasts are very accurate, but those for a month or more in advance are much less so.
This is the opposite to investment forecasts, which are much more likely to be wrong in the short term but have a better track record over the long term.
One of our favourite quotes is from the legendary investor, Benjamin Graham: “In the short run, the market is a voting machine but in the long run, it is a weighing machine.”
Prices over short time periods are mainly affected by sentiment and can move wildly on pieces of new data which can subsequently turn out to be misleading or irrelevant.
Think of the market reaction to US jobs data. This is watched closely as the Federal Reserve partially makes decisions on interest rates with reference to unemployment. Markets often move sharply if the job numbers are substantially better or worse than expected.
However, these figures are often revised later on and sometimes this completely changes the picture.
Over the long term, things like valuations are much more important for markets. Over 10-year periods, the returns of the UK and US equity markets have largely been explained by how cheap or expensive the market was at the beginning of the decade, with a correlation of 80% and 90% respectively. (Source: Refinitiv / Equilibrium Investment Management, using Equilibrium composite scores compared to rates on cash)
As discussed in previous editions of the Pulse, we think the main equity markets in the UK and US look reasonable value, although they are not compellingly cheap.
In the case of the UK, the FTSE 100 has done very well due to its high exposure to energy stocks. In the US, it is because markets were very expensive to start with and last year’s falls have made them cheap-er rather than cheap.
However, we do think certain bonds look extremely compelling, especially corporate bonds of higher quality companies, with much higher yields than a year ago.
Aside from bonds, one of our highest conviction areas to invest in is smaller companies. We tend to have more exposure to small companies than most investors, since there is a large body of evidence showing that small companies grow more quickly than large ones (in aggregate) over the long term.
This position hurt returns last year, as small caps can also fall more sharply when people are worried about the economy.
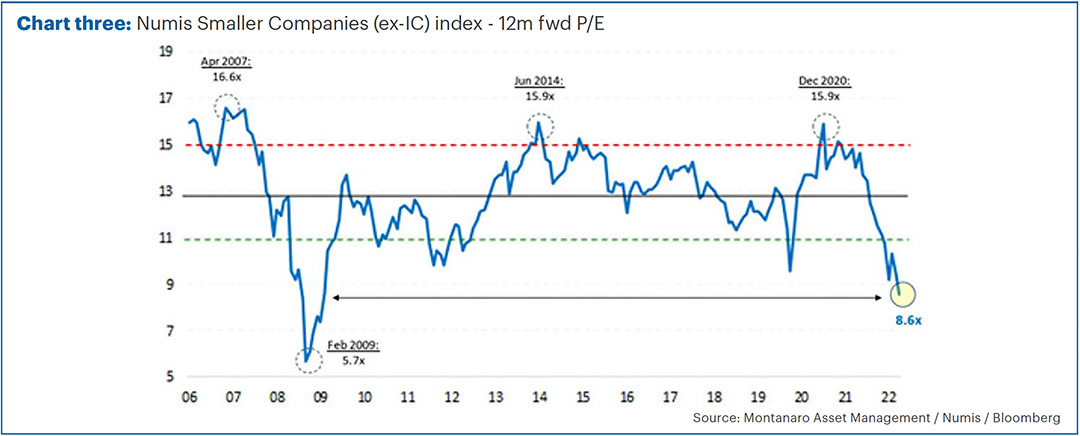
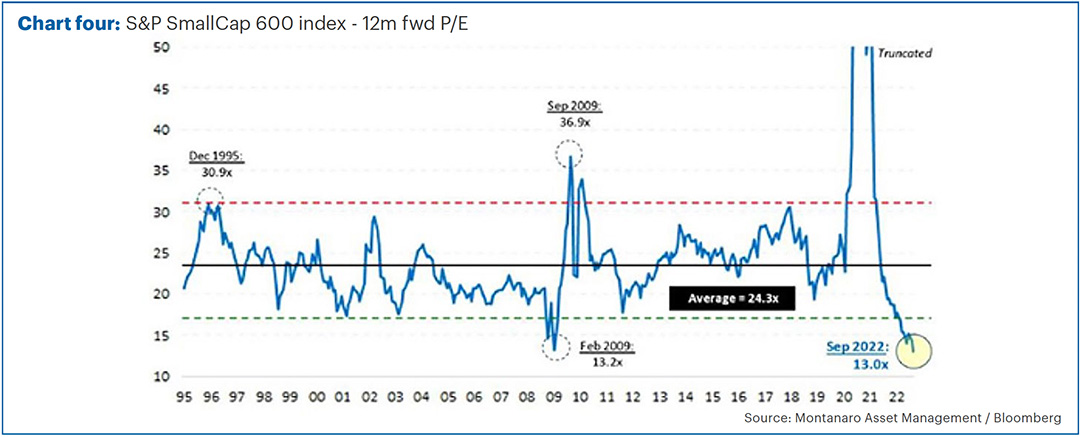
However, these falls make small companies now look very undervalued. Charts three and four show the price/earnings ratio of UK and US smaller companies, compared to their long-term history.
In both cases, the assets have not been this cheap since the financial crisis in 2009.
Chart three

Chart four

Thinking small
So, what happened last time small caps were this cheap?
Here in the UK, the Numis Smaller Companies (ex-Investment Companies) Index returned 124% over the following 10 years, nearly double the return on the large company FTSE 100 index of 61%. (Source: FE Analytics, 1 Feb 2009 to 1 Feb 2019)
In the US, returns were even better, with the S&P SmallCap 600 returning 182% more than the large companies in the S&P 500 Index, which grew 180%. (Source: FE Analytics, 1 Feb 2009 to 1 Feb 2019)
We have recently topped up our exposure to smaller companies, particularly adding some US small cap exposure to portfolios.
We don’t know what will happen in the future, but with valuations this cheap, we think long-term returns may be very positive.
The short-term may be affected by the weather, but if the economy proves more resilient than expected, we think shorter-term returns could be pretty decent as well.
The information and data quoted above is correct as of 10 January 2023 and therefore subject to change after this date.
Past performance is for illustrative purposes only and cannot be guaranteed to apply in the future.
This newsletter is intended as an information piece and does not constitute a solicitation of investment advice.
If you have any further questions, please don’t hesitate to contact us. If you’re a client you can reach us on 0161 486 2250 or by getting in touch with your usual Equilibrium contact. For all new enquiries please call 0161 383 3335.


