
 Mike Deverell
The road to recovery?
It has now been around seven weeks since Russia invaded Ukraine.
Whilst stock markets fell sharply when the conflict began, they have since bounced back and many markets are in fact higher than just prior to the conflict. For example, having hit 7,611 on 15 January, the FTSE 100 dropped as low as 6,859 on 7 March. It has now almost recovered back to its previous high, closing at 7,559 on 11 April.
Furthermore, from 23 February (the day prior to the invasion) to 11 April, the FTSE went up by 2.65% and the S&P 500 gained 4.57%. (Source: FE Analytics, in local currency)
Despite this recovery, most markets remain down significantly so far this year (with the FTSE 100 being a rare exception). Whilst concerns about the direct impact of the Ukraine conflict have subsided, investors remain worried about elevated levels of inflation and the increase in interest rates that seem certain to follow.
Table one (below) shows the returns for a selection of asset classes and indices.
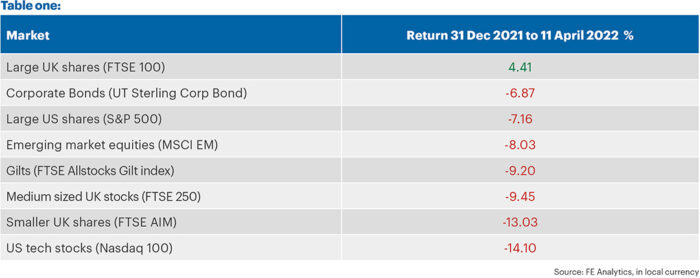
As discussed in previous editions of The Pulse, the FTSE 100 has benefitted from the surge in energy and commodity prices, as it has a high weighting of oil and gas, as well as mining stocks. All the other comparators have lost money, in some cases quite significantly.
As we invest in all the above asset classes (and more), our portfolios have unfortunately gone down since the start of the year. However, for the most part, we have managed to mitigate the losses. For example, our Cautious portfolio lost 2.85% and our Balanced portfolio lost 3.67% (during the same period).
We find any negative period intensely frustrating, although in relative terms, we don’t think this is too bad when the second-best asset class in the table went down 6.87%.
Our portfolios also compare favourably to the average mixed investment fund (the FE UT Mixed Investment 20-60% Shares sector), which lost 3.70%. The Adventurous portfolio went down slightly more at 4.87% due to its longer-term growth bias. By this we mean the greater equity weighting in the underperforming emerging markets, smaller companies and technology shares within this portfolio.
As a point to highlight, all three funds have outperformed the mixed investment sector since launch.
Rapidly rising rates
We have discussed concerns over inflation and rising interest rates in previous editions of The Pulse.
The sharp rise in prices has meant the pace at which rates are likely to go up has also increased. Based on market pricing, the Bank of England base rate is now expected to reach over 2% within the next 12 months, with US rates potentially reaching close to 3% over the same period based on latest market pricing. (Source: The Daily Shot)
Rising rates are particularly bad for bonds, which pay a fixed rate of interest. To remain attractive relative to cash, the yield must go up. This means the price must go down, hence why gilts are down over 9% (Table one).
We find this astonishing for an asset class which is generally considered a safe haven. When investors are worried about the investment outlook, they tend to buy gilts and other government bonds such as US Treasuries. That is because the bonds are guaranteed by their associated government and are therefore considered ‘risk free’ – which is now somewhat questionable.
As every other asset class is compared to this so-called ‘risk-free’ asset, they have all fallen too.
The ‘R’ word…
The bond market may also be signalling something else, as we have recently seen the dreaded ‘inverted yield curve.’ This tends to signal a future recession.
What do we mean by this? Well, in general terms, longer-dated bonds yield more than shorter-dated ones, with investors wanting to be paid more to tie their money up for longer periods.
However, occasionally this relationship breaks down and sometimes shorter-dated bonds yield more than longer-dated ones. When this is the case, we say that the curve has ‘inverted.’ For example, right now a 2-year US Treasury bond has a higher yield than a 10-year US Treasury bond.
Historically, when this happens, a recession has tended to follow within the next year or two.
Chart one shows the difference between the 2-year and 10-year US bonds dating back to the 1980s. The grey shaded areas are the recessions that follow.

Every time the spread between the two bonds has gone below the red line, we have seen a recession shortly afterwards. We often wonder how on earth the bond market anticipated the 2020 pandemic, but the relationship held true during this period as well.
There has been a great deal of speculation as to why this relationship exists and whether things might be different this time. All we can say for certain looking at the market, is that investors expect rates to go up very steeply in the short term and in turn the central banks will be forced to cut them again soon afterwards, as the economies slow down.
We have been saying for some time, there is a potential for the current cost of living crisis to cause a recession. We still think this can be avoided; however, it is more likely to happen if central banks hike rates too quickly.
People are already seeing their incomes squeezed. Putting up the cost of mortgages as well is certainly not going to help matters.
A bit more interesting…
Given this outlook, we believe that central banks may not raise rates as much as investors currently believe.
And, on a more positive note, as bonds fall in response to central bank actions, their yields rise which makes them more attractive to purchase. For example, in mid-December a 10-year gilt had a yield of just 0.75% p.a., with the US equivalent at 1.5% p.a. Those yields are now over 1.75% and 2.75% respectively.
Whilst still low by historic standard, this makes them more attractive than they have been for some time, especially
with the economic outlook so uncertain. If the economy took a turn for the worse, we expect these bonds to rally.
Having had very little government bond exposure at the start of this year, we have been slowly adding to our holdings as bond markets fall.
Instead of holding large amounts of bonds to hedge our equity exposure, we have recently favoured what we call ‘real assets’ such as infrastructure and property.
These tend to provide very solid levels of income, but the real benefit compared to bonds is that these incomes tend to go up with inflation.
Chart two shows the returns of our property and infrastructure portfolios compared to gilts for the period of 31 December 2021 to 11 April 2022.
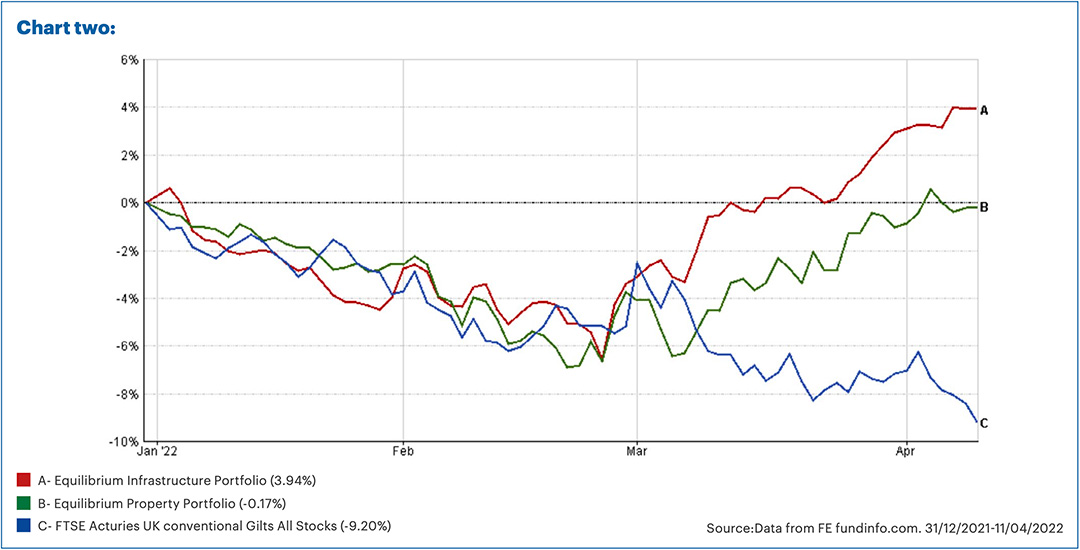
Whilst these assets failed to avoid the falls in January and February, they have since recovered very well. We were able to use this volatility when we increased our exposure during early March and subsequently benefitted from the rebound.
We also added a small amount to equity exposure during the sell-off which has boosted returns.
As always, we think it makes sense to be well diversified and continually look for opportunities to use volatility. Markets tend to rise over the long term and we believe short-term losses are often an ideal time to top up at attractive prices.
Past performance is for illustrative purposes only and cannot be guaranteed to apply in the future.