
 Mike Deverell
This article is taken from our autumn 2020 edition of Equinox. You can view the full version here.
We’ve always aimed for returns well ahead of inflation over the long term.
Depending on the portfolio, we target a positive “real return” over rolling five- year periods, with an aim to generate between 4% to 5.5% pa above CPI (consumer prices index) over 10 years or more.
In July 2007, the Bank of England base rate was 5.75%. With inflation at 1.9%, the real return on a typical cash account was therefore 3.85%, not far below our target return.
Fast forward to July 2020 and rates are now 0.1%. Even with CPI at a very low 0.6% pa, the real return on cash is minus 0.5% pa. That is a very different starting point for building a portfolio!
We are often asked whether our target returns remain realistic given this backdrop. We therefore set out on a wide-ranging project to determine whether the portfolio objectives remain realistic and relevant to clients.
Project Phoenix was born. We felt this was apt given we were about to metaphorically set fire to our investment process and see what rose from the ashes!
Super-forecasting???
Forecasting investment returns is not easy but there are metrics in many asset classes that have historically been well correlated with long-term returns.
The lowest risk asset apart from cash is traditionally government bonds. When you buy a UK government bond or gilt you are lending them money for a fixed period, for a fixed level of interest. If you purchase a gilt and hold it until maturity you know exactly what your return will be in advance.
For the gilt market as a whole things are not that simple, because the price of gilts fluctuates according to demand, but the yield on a 10-year gilt is a pretty good indicator of what gilt returns are likely to be over the following decade.
Chart one shows the historic relationship between gilt yields and returns. Each dot represents a different 10-year period for UK gilts. The higher the dot is on the chart, the higher the annual return was over that decade. The further to the right, the higher the yield was at the start of that decade.
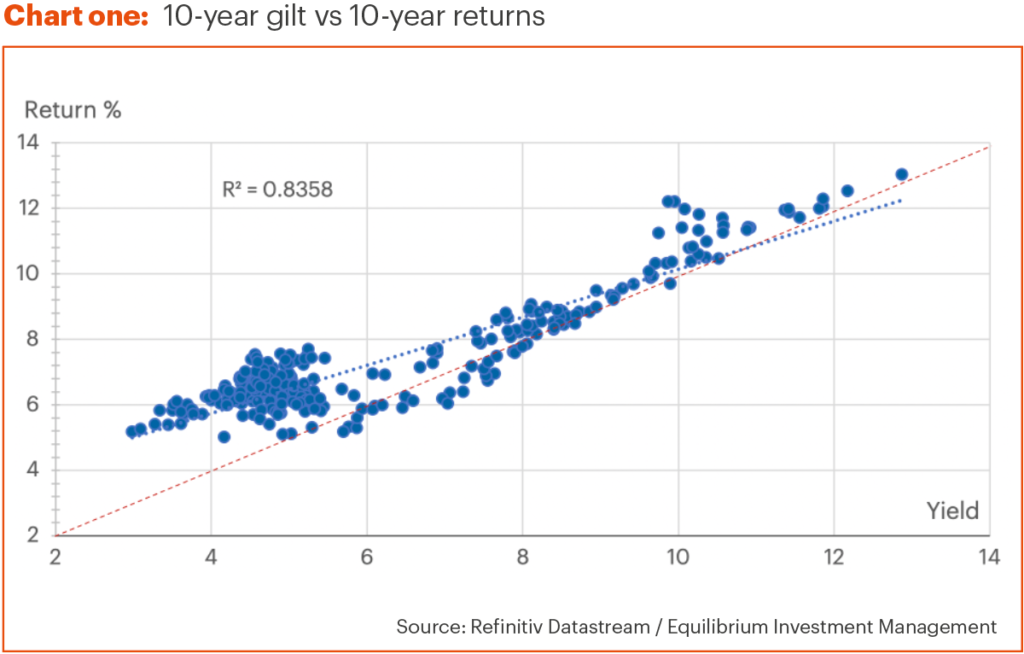
The chart shows a clear pattern – the higher the yield at the start of the decade, the higher the return you received with an 83% correlation (an R-squared of 0.83). The blue line shows the calculated line of best fit, whilst the red line shows where the return and the yield are equal.
Generally, your return has been the yield plus or minus around 1% pa. For the most part, returns have been greater than the yield. We have had a period of falling interest rates for the last few decades which generally drives up gilt prices.
If this pattern holds, with yields currently around 0.1% pa, we can expect gilt returns between roughly -0.9% and +1.1% pa over the next decade.
Using historic “spreads” or risk premiums, we can use this to derive forecasts for corporate bonds where we are lending money to companies rather than governments. Here we might expect returns of perhaps 2% pa for “investment grade” companies (those with a credit rating of BBB or above).
We can also carry out a similar exercise for commercial property, where the rental yield has been a decent forecaster of returns. This would imply a return of perhaps 3.5% pa over the next decade.
In our view, the traditionally lower risk asset classes of fixed interest and property are not likely to provide very high levels of returns over the next decade. To get close to our target returns, we either need very low levels of inflation, or we need to get some decent returns from our riskier assets, like equities.
Risky business
There are many ways of valuing equities, such as looking at the ratio between price and current earnings, forecast earnings, cash flows, or book value.
We combine all these into a single valuation score for each main region. We have used this process for a while, and it has appeared to be a reasonable forecaster of what is a highly unpredictable asset class! However, we noticed something strange in the data…
In essence, from the mid-2000s the returns we saw were lower. The valuation score still had a high correlation with returns, but at a noticeably lower annualised rate than previously.
We theorised that it might have something to do with interest rates. In the early 2000s, the UK base rate averaged around 4.5% pa. Since the financial crisis, the average has been 0.5% pa. Could that explain the drop in equity returns?
We therefore adjusted our data not to look at the simple return on the stock market, but the return of the market relative to cash.
For the UK, the correlation of our scoring metric and returns increased from a decent 64% relative to nominal returns, to a very strong 78% for returns relative to cash.
Chart two shows this relationship. Again, each dot represents a different 10-year period and the higher the dot the higher the return relative to cash. The further to the left, the “cheaper” the market was at the start of that decade.
We have circled on the chart the current “score”.
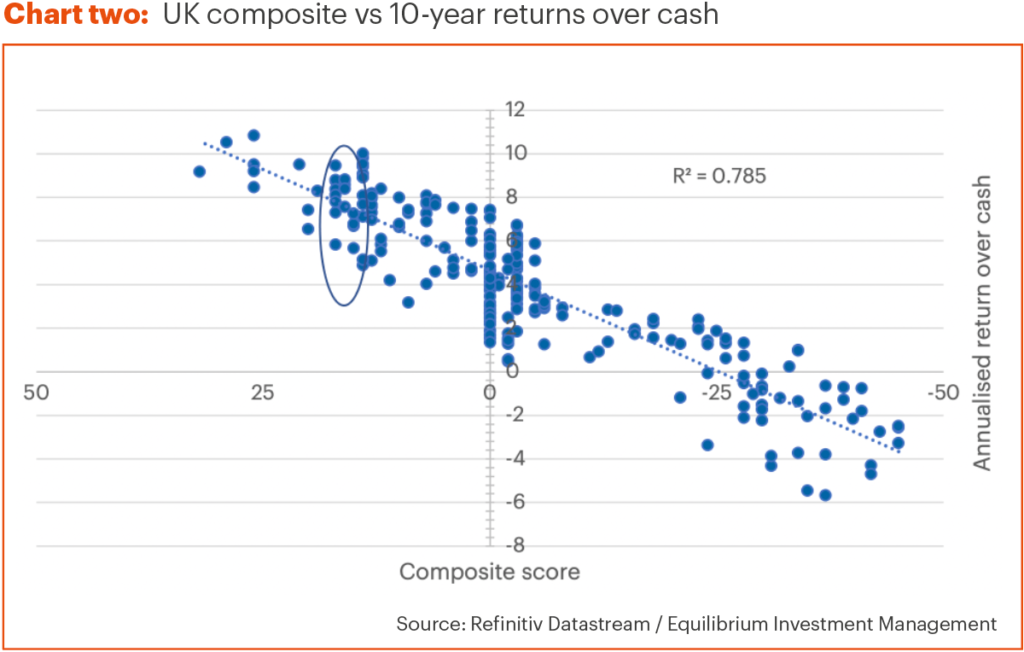
Chart three shows the same thing but in a different way. The green line shows how our score has changed over time (left-hand axis). The gold line shows the subsequent 10-year return relative to cash (on the right-hand axis).
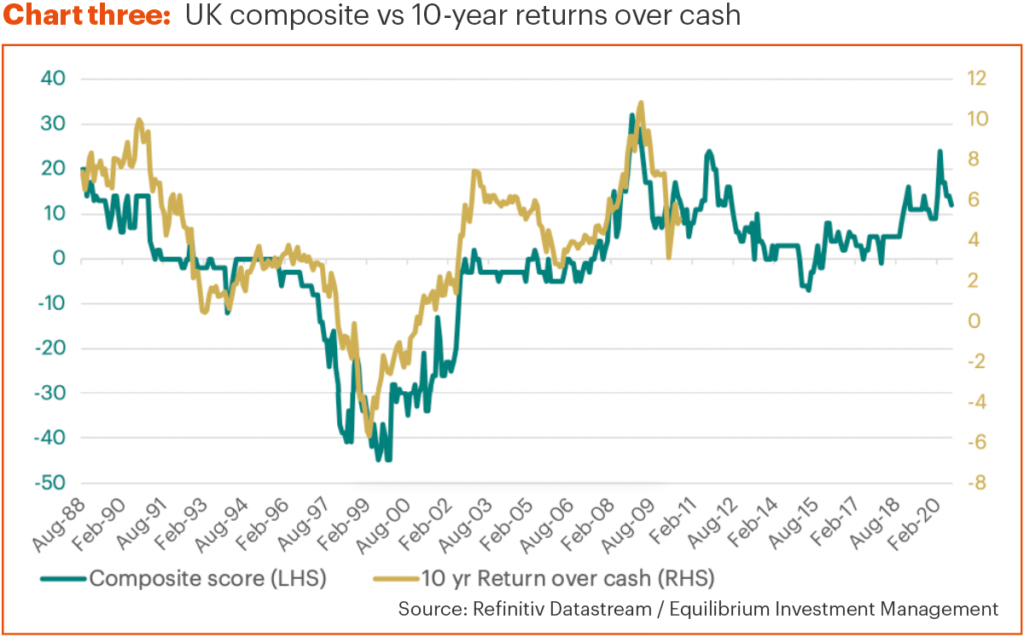
The two lines follow each other closely. Note that the gold line stops in 2010 as that was when the last 10-year period began!
This implies returns on UK equities of perhaps 8% pa ahead of cash. But what will cash returns be?When rates were at 5% pa we might have been looking at a relatively healthy 13% pa!
We think rates will remain very low for the foreseeable future and we can’t see them getting above 2% pa at any time in the next decade. The return on cash is likely to be perhaps 1% pa for the next 10 years, implying perhaps 9% pa on UK equities.
We have carried out the same exercise for other regions and seen similar results. This implies lower returns for European and US equities, but potentially some very good returns from emerging markets.
It goes without saying that no forecasting tool is perfect and of course we provide no assurances about whether these returns will be achieved.
Real-ly low?
I said right at the start that we are targeting real returns, and therefore we also need to try to forecast inflation.
Whilst there are plenty of market- based metrics around, they all have their flaws. For example, by comparing index linked gilts with normal gilts we can work out what level of inflation is expected. Unfortunately, this metric is always skewed by high demand from the likes of pension funds who have inflation-linked liabilities.
Adjusting for such flaws, we expect inflation to be lower than the Bank of England’s target of 2% pa over the next decade. Our expectation is for CPI to be closer to 1.5% pa.
Risk and return
Coming back to the original question, “are our return targets still appropriate?”, the answer is a qualified “yes”.
The reason the yes is qualified is that to achieve them we are relying on the most volatile of the main asset classes.
Our asset allocation “table” usually has four main legs: equity, fixed interest, property and cash. If returns on the last three are going to be low, then we are essentially relying on one leg. This makes things inherently unstable.
Each portfolio has a minimum and maximum level of risk which we are allowed to take. To achieve the objectives, the average exposure may need to be more towards the higher end of the ranges.
However, there are several ways we can try to eke out extra returns. Examples might be using defined returns instead of traditional equity, which often have double digit potential returns even if the markets only return single digits.
We can also use alternative assets like infrastructure which we think looks to be good value and which could be viewed as a partial replacement for property. The asset classes have a lot in common, being based on “real” physical assets, which provide an income and some inflation protection.
That said, if we’re going to have to take somewhat more risk to get the same levels of real return we’ve seen in the past, this might make some clients uncomfortable.
We are therefore developing a new, more defensive portfolio, which will have a lower target return but also less volatility. Provisionally, the portfolio will aim to provide a positive return over rolling three year periods and outperform cash by 3% pa over the long term.
Watch this space for further announcements!
Disclaimer: The content contained in this blog represents represents the opinions of Equilibrium Investment Management LLP (EIM) and Equilibrium Financial Planning LLP (EFP). The commentary in no way constitutes a solicitation of investment advice. It should not be relied upon in making investment decisions and is intended solely for the entertainment of the viewer. Past performance is never a guide to future performance. Investments may (will) fall as well as rise and you may not get back your original investment.’