
 Mike Deverell
Exceptions to the rule
COVID-19 has, of course, hit many businesses hard.
However, there are some big exceptions where firms have not just held up well but actively benefitted from the current situation.
Many of these firms are technology-based firms. As discussed in previous newsletters, the likes of Amazon have seen massively increased sales as we all move to shopping online, Microsoft is benefitting from homeworking, plus, many of us have been watching a lot more Netflix than usual!
This has had a strange effect on global stock markets. Those countries whose indices have plenty of tech exposure have recovered extremely well from the lows in March. Those indices which are more exposed to financials and energy stocks remain substantially down so far this year.
Chart one shows the total return of various country indices and how different sectors have contributed to that total return.
Chart one:
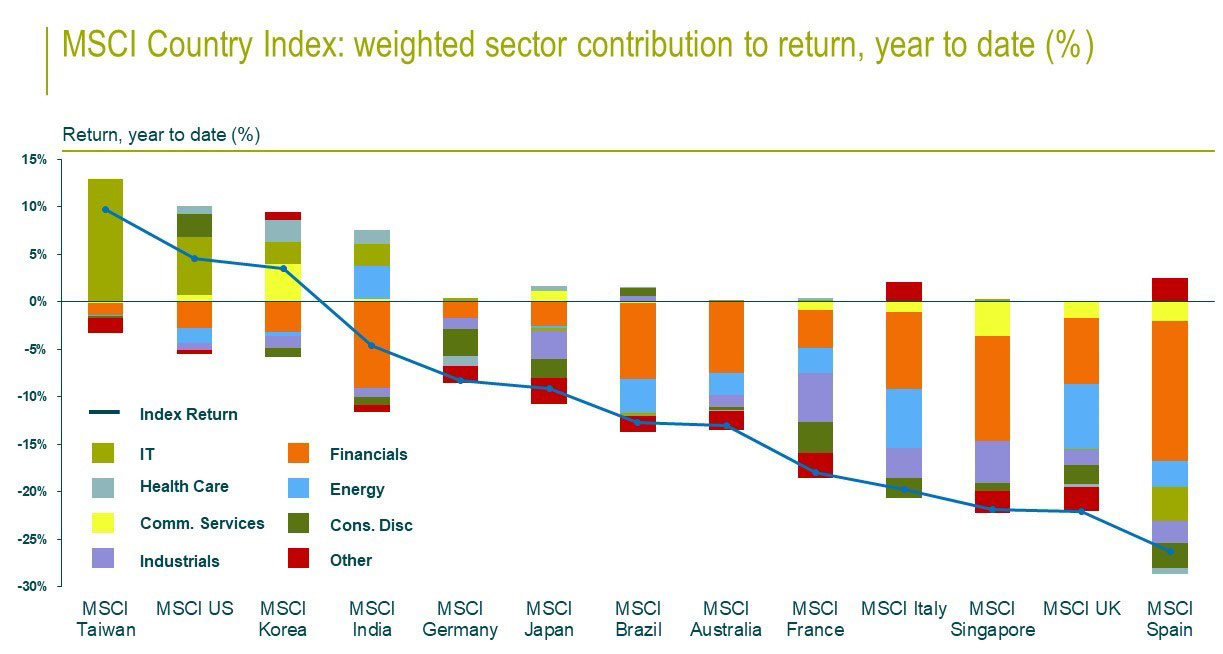
Source: M&G, Datastream, 17 August 2020
The UK market remains stuck in the doldrums. It has very little tech and its largest companies are banks and oil companies and, partly as a result, it is one of the worst performing markets this year. It has underperformed the likes of Italy and France, both hard-hit by the virus, with only Spain doing worse.
Concentrate…
The best performing index this year has been MSCI Taiwan, driven almost entirely by the IT sector.
We do need to be somewhat wary looking at certain indices however, as almost 28% of the Taiwanese market is accounted for by just one company, Taiwan Semiconductor. Their components are to be found in many smart phones, computers and televisions.
The next best performing market has been the US where IT and consumer discretionary have been the biggest drivers. Whilst the US market may not be quite as concentrated as Taiwan, the big tech stocks now account for a very large proportion of the index.
Chart two shows how much of the US market is represented by the top five stocks. The market has never been this concentrated, with Microsoft, Apple, Amazon, Alphabet (Google) and Facebook now making up nearly a quarter of the S&P 500. The previous peak was in the year 2000 during what we now call the dot com bubble but, even then, the top five only represented around 18% of the market.
Chart two – top five companies % of S&P 500 market cap
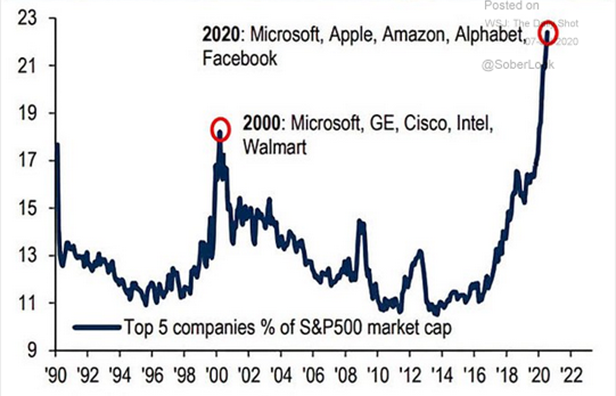
Source: BofA Global Investment, Bloomberg
This means that what happens to these big tech firms will now drive the direction of the US market. If they continue their dominance, the US market will continue to do well and outperform most others. If they falter, the US market is very vulnerable to a correction.
We have discussed previously that these big monopolies could be subject to some sort of anti-trust legislation in the future or special taxation, particularly if there is a Democrat in the White House.
Whilst such action remains an outlier, if it happens it could have a significant effect.
At your discretion
One of the biggest drivers of US outperformance has not been IT as such but the consumer discretionary sector.
Based on its name you might think that this sector is full of things like luxury goods, or at least those things which are discretionary rather than necessary purchases (staples). These are the sorts of things which we might expect people to stop buying during a recession. Well not this recession!
A quick glance at the constituents of this sector and we can see it has a distinctly “techy” feel. The top stock is Amazon, next is Alibaba (perhaps the Chinese version of Amazon). Tesla and Netflix are also in the top 10. What is and what isn’t a tech company these days is not always clear!
After such a fantastic run, the IT sector is looking pretty expensive relative to history. However, some of the valuations in the consumer discretionary sector are eye wateringly expensive!
Chart three shows various different five-year returns for the global consumer discretionary sector. Long-time Equilibrium clients and readers of our newsletters will be familiar with similar charts for different country indices. This chart works in a similar way but looks at an individual sector instead.
Each dot represents a different five-year period for the sector. The higher the dot on the chart, the higher the returns over that five-year period.
Along the horizontal axis is the price/book ratio of that sector at the start of those five years. This is one of our favourite valuation metrics which looks at the total value of a company implied by its accounts, compared to the total value of its shares.
Chart three: Datastream consumer discretionary sector, price/book ratio vs five-year annualised returns
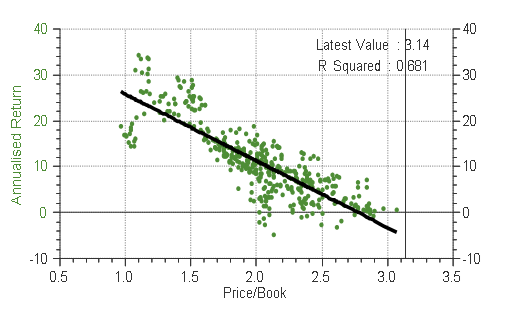
Source: Refintiv / Equilibrium Investment Management
As with most country indices, with this sector there has historically been a strong relationship between valuation and returns. When valuations have been low, we tend to see high returns and when things are more expensive we tend to see low returns. The correlation is pretty high (an r-squared of 0.68 or roughly a 68% correlation).
The vertical line shows the latest value of this sector. It is almost literally off the scale.
We have never had a five-year period when the price/book has been as high as it is now. Those historic periods that came close to being as expensive saw returns of roughly zero.
We are fans of a good deal of the companies we mentioned and hold many of them in our portfolios. We added to our tech exposure when markets were lower, we believe in the long-term trends and agree that such trends have been accelerated by the current situation. That justifies a high valuation in our opinion, but perhaps not this high!
At current levels, we have to be wary about whether this run of performance can be sustained. The risk of a significant pullback is increasing in our view. However, if one occurs it might represent a good buying opportunity.
Risk warning: these represent Equilibrium’s collective views and in no way constitutes a solicitation of investment advice. The value of your investments can fall as well as rise and are not guaranteed. Investors may not get back the amount originally invested. We usually recommend holding at least some funds in all asset classes at all times and adjusting weightings to reflect the above views. These are not personal recommendations, so please do not take action without speaking to your adviser.