The big question: Save or invest? - Equilibrium
Get in touch
Ask us a question


    The big question: Save or invest?

    When markets are down and interest rates are high, it’s only natural to be attracted by a glittering percentage of growth being offered by high street savings accounts. But all that glitters isn’t gold. While many magpies flock towards investing in cash, wiser owls remove the emotion, revisit the evidence, and take in the whole picture. So, when it comes to the big question of whether you should save or invest, know your options, and acquaint yourself with our expert knowledge below. Remember, short-term pain leads to long-term gain!

    Investing vs cash and inflation

    In this video, Investment Manager, Mike Deverell, explains why investing your money is so important if you want to see your savings grow, over and above inflation, over the long term.

    Holding cash in a savings account may appear attractive right now given the volatile market conditions and the value of investments going down, however, there are a couple of questions to ask yourself when pursuing the best savings rate:

    Am I willing to tie up my money for a set period?

    Will my savings interest be liable to tax?

    (9 minute watch)

    Need-to-know information

    Basic rate taxpayers are liable to 20% tax on all earned interest over £1,000.

    Higher rate taxpayers are liable to 40% tax on all earned interest over £500.

    Additional-rate taxpayers have no savings allowance with all savings interest liable to 45% tax.

    Do equities protect against inflation?

    Investing in the stock market can help protect your savings against the impact of inflation over the long term.

    Inflation is the rate of increase in the cost of things that we buy.

    Interestingly, the rate at which we feel the impact of inflation will vary for every one of us as it depends on our unique spending habits.

    You can even calculate your own inflation rate using the Financial Times personal inflation calculator.

    Of course, everything we buy is being sold by someone else, usually a company.

    If customers have to pay a company more to buy their product than they did in the past, and the company’s sales volumes remain constant, that company will see its revenue increase. However, the company may also experience an increase in its own costs.

    The illustrative example below shows how equities can protect against inflation.

    Equity vs inflation example

    To consider how inflation might impact a company’s share price, let’s look at a really simple example.

    The table below shows the basic finances of a mythical company, we’ll call Widgets PLC.

    Costs per share (£)Revenue per share (£)Profit per share (£)Share price @ 10 x PE (£)
    10011010100

    The costs of making the Widgets work out as £100 for each share the company has issued.

    The company makes revenue from selling the finalised Widgets of £110 per share.

    This is a profit of £10 per share.

    For this simplified example, we’ll assume companies in this industry normally trade on 10 times profits – a price/earnings (P/E) ratio of 10x.

    At £10 earnings per share, this gives a share price of £100 each.

    What is the impact of inflation?

    Let’s assume that Widgets PLC has what we call “pricing power”. Their products are in demand, and there aren’t many competitors in their industry.

    As inflation rises, so too do the costs of making Widgets.

    However, because Widgets PLC has pricing power, it can pass these cost increases on to consumers in full.

    In other words, if costs increase by 5% (for example), Widgets PLC can increase their selling prices by 5%.

    We’ll also assume that sales volumes remain the same – they sell just as many products at the new price as they sold at the old one.

    The table below shows the effect of different levels of inflation on the finances of the company.

    Inflation rate (%)Costs per share (£)Revenue per share (£)Profit per share (£)Share price @ 10x P/E (£)Share price growth (%)
    100110.0010.00100
    3103113.0010.301033
    5105115.5010.501055
    10110121.0011.0011010
    15115126.5011.5011515
    20120132.0012.0012020

    As you can see from the above, based on these assumptions, the profits of the company increase in line with inflation.

    If we assume a constant share price of 10 times earnings, the share price will also increase in line with inflation.

    Of course, this is a very simple example and ignores all sorts of factors. For example, the company may not be able to pass on price increases in full. Sales volumes may fall as prices increase. Higher interest rates to control inflation can have an impact.

    On the other hand, this example also ignores the potential growth the company could achieve over the long term.

    Summary

    Inflation can have a big detrimental effect on finances over time. Leaving our money in cash can mean that the purchasing power of our savings may decrease.

    However, investing your money can help it grow over and above inflation in the long term.

    Whilst the example in this article is highly simplified and fictional, in times of high inflation, we do look for companies just like this one. We look for high-quality companies who have pricing power, and where there are “high barriers to entry” for their industry, making it difficult for competitors to take market share.

    What is a bond?

    It’s important to stress that higher interest rates (like in the current environment) don’t just imply higher returns on cash. They imply higher returns on other asset classes too, notably bonds, where yields are much higher than in previous years, and as shown in the indexes below, that implies much higher returns.

    Right now, our investment team are very positive about the outlook for bonds. We recognise that some clients can find bonds confusing so in this section, we explain how they work, and why we think now might be a good time to invest in bonds and benefit from higher interest rates.

    (10 minute watch)

    What is a gilt?

    Often referred to as UK government bonds, where an investor lends money to the UK government and in return, they receive a gilt.

    The gilt will have a redemption date (date to maturity) at which point, the nominal value is returned (typically the amount it was originally sold for) however, during the term of the gilt, a regular income is paid (known as the coupon).

    Gilts are used by the UK government to raise money (usually to cover the shortfall between public spending and income from taxes) and are generally considered to be safer than investing in a company.

    Interest rates play a huge part in the price of a gilt – when base interest rate rises, the price of gilts tend to fall. This is because the interest on offer won’t look as attractive compared to that of the prevailing interest rate.

    If the price of gilts fall, it also means that the yield increases – what you get as a percentage of the price you paid.

    In order to become more attractive to investors, gilts need to offer a higher coupon rate which will in turn push up demand and price. See how a gilt works in the example below.

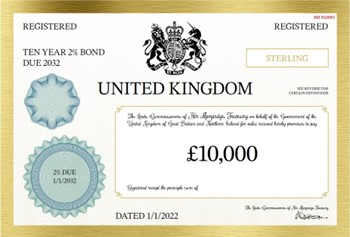
    Example of a gilt

    Simplified example for illustrative purposes only.

    We lent the government £10,000 on 01/01/2022. A 10-year bond which matures on 01/01/2032. On maturity, we will receive our original £10,000 back. In the meantime, we will receive a coupon of 2% p.a.

    In the digital era we now live in, we can check a gilt’s value on a daily basis (if we want to). Not only that, but we can measure its mark to market. Let’s consider the following example.

    If, for example, the following day, there was a change in government policy and as a result, the Bank of England had to put up interest rates overnight. Investors now want a coupon of 4% p.a. to lend money to the government for 10 years, therefore, a day after we bought our gilt, a new 10-year gilt was issued at 4% p.a. which leads us to question, what is our gilt worth now?

    New gilt offers 4%, our gilt offers 2%. The difference is £200 p.a. x 10 years = £2,000 less interest over 10 years. Therefore, our gilt is now worth £8,000 if sold today, a 20% loss.

    But only if we decide to sell it…

    If held to maturity, we will receive £200 every year and although it is only worth £8,000 today, the capital value will gradually appreciate back to £10,000 by 2032.

    What is a corporate bond?

    A corporate bond functions similarly to a gilt, but with a key distinction: you lend money to a company, not a government. This adds risk as companies can go bankrupt, potentially leading to partial or total loss of your investment.

    Because of this extra risk, companies that issue corporate bonds will typically pay higher interest than a gilt.

    A secure “investment grade” company (rated BBB or above) might offer around 1.5% to 2% p.a. extra interest. A “high yield” bond (lower credit ratings) could be 4% to 6% p.a. more than a gilt.

    As with a gilt, if you hold a single corporate bond to maturity (and the company does not default) you know exactly what return you will get when you buy it.

    However, in the meantime, the price of the bond can fluctuate due to changes in interest rates (which make the fixed-rate bond more or less attractive by comparison) or perceptions of the risk involved.

    Take a look at the example below which illustrates how a corporate bond works. The example is a single corporate bond from a company you will be familiar with, the supermarket firm Tesco.

    Example of a corporate bond

    In particular, we’re looking at the Tesco 5.5% 2035 bond.

    Here are some of the key facts of this bond:

    • It was issued in February 2023 and will mature in February 2035 (12-year term).
    • Each bond was issued at £100 and will mature at £100 in February 2035.
    • At outset it paid a coupon of 5.5% p.a., which is a fixed interest payment of £5.50 per bond per year.
    • Tesco is BBB rated.

    Whilst it was only issued in February (approximately 6 months ago), interest rates have moved higher than expected. As a result, to remain attractive, the bond has fallen in price. Here are some of the characteristics now:

    • There is roughly 11.5 years to maturity.
    • The price has fallen to £93.
    • The £5.50 coupon is now 5.9% of the current price (running yield).
    • If held to maturity, investors will also make a £7 capital gain (as price goes from £93 back to £100).
    • The current yield to maturity is 6.25% p.a. – this is the total annualised return if held to maturity including all income payments and the capital gain.

    Imagine a £10,000 investment…

    Let’s assume you had invested £10,000 into this bond when it was issued.

    • If you had invested £10,000, it would now be worth only £9,300 (£700 loss).
    • But if you hold to maturity, you will make a £700 gain (7.5%).
    • Add the coupons of £550 p.a. x 11.5 = £6,325 income.
    • Total return if held to maturity would therefore be £7,025 = 75% (6.25% p.a.).

    What are the risks?

    Whilst we know what return we will get if we hold to maturity, this return is unlikely to come in a “straight line.”

    Let’s assume Tesco is unlikely to go bust during this period. Therefore, the main risk to this bond is if interest rates go up further than expected. If so, the price might fall further.

    Let’s assume investors want an additional 1% p.a., so the yield needs to increase from 6.25% p.a. to 7.25% p.a.

    Because we know all the cash flows of this bond, we can calculate what will happen to the price in this scenario.

    The bond would have to drop a further 8.26% in price to increase the yield to maturity by 1% p.a.

    In this example, the price would drop to c.£85.30 so our £10,000 investment would now be worth £8,530 – a further loss of £1,470.

    This would be quite painful in the short term, but don’t forget we’re still receiving annual income payments of £550 on our £10,000 investment.

    This will cushion the blow and in fact over 1.5 years we would receive more income (£1,650) than this loss (£1,470).

    And don’t forget, we will still get back £10,000 at maturity, so the capital value should gradually appreciate as the term goes on. We just need to be patient.

    Summary

    We think corporate bonds look quite attractive, because even fairly secure companies, like Tesco, are paying yields in excess of 6% p.a.

    If interest rates go up further than expected, in the short term we might see further capital losses, but these would likely be relatively temporary in nature.

    Don’t forget that if rates don’t go up as much as expected, or are even cut, then the opposite could happen, and we could get a capital gain in the short term too.

    We also invest in high-yield bonds, where companies have lower credit ratings. On the funds we hold, the yield to maturity of these bonds is around 10% p.a. (Source: EIM / the various fund managers, 30 May 2023)

    For more detail of how high-yield bonds work, and the risks involved, please read the next section.

    What is a high-yield bond?

    A high-yield bond is a form of corporate bond (see above). High-yield bonds are simply those that have a lower credit rating (BB+ or lower). This means there is more chance of the company going bust and defaulting.

    As a result, investors demand a higher level of interest to lend money to those companies.

    Whilst riskier, we have selected specialist fund managers who will do credit analysis to check the security of the companies.

    High yield doesn’t necessarily mean these are lesser-known companies. Some of the top holdings in one of the high-yield funds we hold include Santander Bank, Heathrow Airport, and EDF Energy (who are mainly owned by the French Government). (Source: Royal London Asset Management)

    At present, the yield to maturity on the high-yield funds we hold in our portfolios is circa 10% p.a. (Source: EIM / the various fund managers, 30 May 2023)

    We think the income we are getting paid more than compensates us for the extra risk, even if the economy goes into a deep recession.

    Example of a high-yield bond

    For ease of maths, let’s assume the 10% p.a. yield on our funds is all paid out as income.

    We’ll also assume 10% of those companies go bust in the first year, and we lose 100% of the money we’ve lent to those companies. We, therefore, make a capital loss of 10%.

    However, imagine that the remaining 90% of our bonds continue to pay us our 10% p.a. coupon, which means we continue to receive an annual income equivalent to 9% of our initial investment.

    In this extremely negative scenario, we lose 1% in the first year (9% income received, minus 10% capital loss).

    We then continue to receive the 9% income in the next year, so by the end of year two, we’ve made a total return of +8% (assuming no further defaults).

    We think a scenario as negative as this is highly unlikely. In the financial crisis (the worst period we can find), the default rate on European high-yield bonds reached 10% and it was closer to 16% in the US (according to data from Deutsche Bank).

    Importantly, a corporate default does not usually mean you lose 100% of your money. Creditors of companies who go bust can usually recover some of their money once assets have been sold. Over the last 25 years, the average recovery rate on a high-yield default has been 40%. (Source: DWS Research Institute)

    Therefore, in the (in our view highly unlikely) scenario that 10% of our bonds suffered a default, we perhaps might lose 6% capital (10% initial loss plus the 4% recovered from the liquidators).

    Applying this to the above scenario, with 9% p.a. income from the remaining bonds, we might therefore make a 3% GAIN over 12 months.

    Of course, these are simplified examples, and we can’t predict what will happen in the future, but looking at past history provides a lot of comfort. It also ignores the “mark to market” effect, where the price of other bonds might be temporarily marked down due to sentiment.

    Summary

    We believe the potential return of high-yield bonds is very attractive right now and is roughly in line with what we’d expect from equities over the long term. Whilst they are not without risks, high-yield bonds are usually considered less risky than equities. Therefore, we think the risk/reward trade-off is quite compelling at present.

    What returns can I expect from bonds?

    As you can see bonds are relatively simple and in isolation, you know exactly what you will get back on maturity. However, we don’t just hold one bond, we hold a portfolio of bonds, but the principle remains the same.

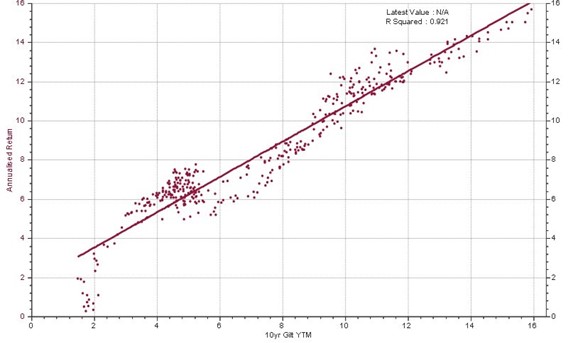
    View the scatter graphs below. Note that each dot represents a different 10-year period, with higher dots indicating greater returns. The horizontal axis displays the initial yield for each 10-year period.

    It’s important to stress that higher interest rates (like in the current environment) don’t just imply higher returns on cash.

    They imply higher returns on other asset classes too, most notably bonds, where yields are much higher than in previous years.

    As shown in the examples below (taken from the gilt, corporate and USD index) that implies much higher returns.

    Examples of expected returns from bonds

    Source: Refinitiv Datastream / Equilibrium Investment Management 30/01/90 – 30/06/23

    The highest returns produced 14-16% p.a., whilst the lowest returned less than 2% p.a.

    The dots show a near-straight line with a strong correlation of 92% – gilt returns are low when yields are low and high when yields are high.

    The current yield on a 10-year gilt is approximately 4.5%. Most of these periods returned above 6% p.a. and occurred when interest rates were being cut.

    The yield gives a good indication of what returns might be.

    A similar thing is true of corporate bonds but here you are lending money to a company rather than the UK government which means you are taking on a bit more risk – expand the corporate bond index below.

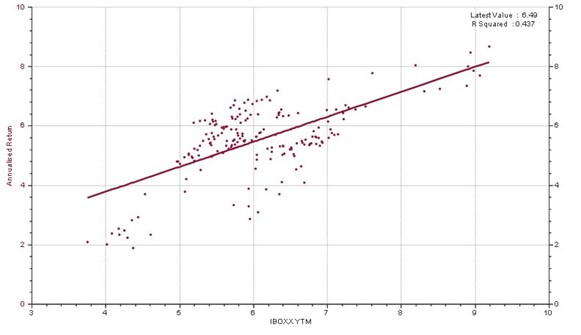
    Source: Refinitiv Datastream / Equilibrium Investment Management 30/01/08 – 30/06/23

    Considering the above investment grade corporate bonds (secure companies with a higher credit rating), we can still see a similar pattern to the gilt index albeit with a slightly more variation.

    If you start with a low yield, you will likely receive a low return and vice versa with a high yield.

    The current yield on this index is currently in the region of 6.5%.

    Historically, over 10 years, the average return tended to be 5-7% p.a. when the yield started with 6.5% (a similar environment to now).

    Whilst corporate bonds come with slightly more risk and variation, we can still see a good indication of what the returns are likely to be based on the current yield of 6.5%.

    For comparison, consider high-yield bonds which are riskier given they are issued by companies with lower credit ratings – expand the high-yield bond index below.

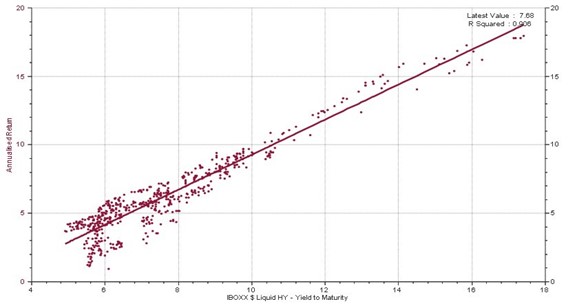
    Source: Refinitiv Datastream / Equilibrium Investment Management 30/01/10 – 30/06/23

    Note: There is less data history and therefore we are looking at rolling 5-year periods.

    Once again, we can see a strong correlation – low yield/low return, and high yield/high return.

    The current yield on the US dollar index is approximately 8% and in the past, we can see returns of approximately 8% when the yield has been at this level.

    Within our Equilibrium high-yield portfolio, the current yield is in the region of 10% p.a. from the funds that we invest in. This is because these funds can invest globally, are more selective of which companies they lend to, and carry out due diligence to ensure risk is minimised. Historically, yields at 10% have produced a similar return of approximately 10% p.a.


    This page is intended as an information piece and does not constitute a solicitation of investment advice. 

    Past performance is for illustrative purposes only and cannot be guaranteed to apply in the future.

    If you have any further questions, please don’t hesitate to get in touch with us on 0808 156 1176 or by reaching out to your usual Equilibrium contact.

    • /

    Get in touch with us today by completing the form. Alternatively, don't hesitate to call us using the numbers below.

    New Enquiries: 0161 383 3335
    Existing clients: 0161 486 2250


      If you'd like a call from one of our financial planners please complete the form below.


        Group 6 Created with Sketch.

        In order to get the best viewing experience of this website, we recommend downloading one of the browsers below: