
 Neal Foundly
“War in Europe, major negotiations about global tariffs and concerns about overvalued technology companies but with hopes of lower interest rates in the coming months.”
Not a headline from last week but the state of the world thirty years ago in 1995. The war in Bosnia was raging, the World Trade Organisation was formed, and the ‘dotcom’ boom was kickstarting that year (oh, and Toy Story was smashing it at the box office!). These three themes – war (or lack of it), trade and technology – were key to what followed for the next three decades.
War and peace
The Bosnian conflict was the last armed conflict in Europe which was eventually resolved by the end of 1995.
At the time, defence expenditure in the EU was around 3% of GDP. The “peace dividend” in Europe, the economic benefits reaped from reduced military spending following the cessation of fighting, allowed countries to shift resources towards public services like healthcare, education and fiscal policies to promote economic growth.
However, the Russian invasion of Ukraine in 2022 has led to a re-evaluation of defence priorities and an end to this period of reduced military spending but in the intervening period, served to boost demand growth.
Enter the Dragon
The creation of the World Trade Organisation (WTO) in 1995 was a significant point in global economic history.
In particular, it was China’s admission to the WTO in 2021 that changed the global economic order. China has benefited massively from enhanced trade flows made possible by its WTO membership, becoming the largest trader in goods and the second largest trader in services in the global economy today.
This was a global win/win. Within China there were significant gains from 1990 to 2015, whereby extreme poverty declined from 67% to under 1%.(1)
On a global scale, the rapid rise in exports of low-cost Chinese products helped keep western inflation in check whilst the Chinese market of nearly 20% of the world’s population opened up (to varying degrees) to western companies.
That interweb thingy
1995 was the year you used the Netscape Navigator browser to check AOL or Yahoo! for emails with dial-up internet, which was a screechy phone-based way of getting online. If you did, you were definitely an early adopter because less than 2% of the UK population had internet access.(2)
But this was the start of something much bigger – it was the start of the technology boom, both in terms of online business and stock market returns.
Online sales were less than 0.5% of total retail sales but growing rapidly.(3) Amazon was not listed on the stock market for another two years; Google was not founded for another three years; Mark Zuckerberg was celebrating his 11th birthday and would not launch Facebook for another decade.
Yet investors could see the future trend. Between 1995 and 2000, the technology-laden Nasdaq Composite Index rose 400%. Many companies that investors favoured saw amazing share price gains – in 1999, shares of telecoms equipment company, Qualcomm, rose in value by 2,619% and twelve other large stocks each rose over 1,000%.
The boom continued until March 2000, when the NASDAQ Index peaked. Interest rates were rising, there were concerns that Japan was going into recession and the merger of Yahoo! and eBay was in doubt (at the time Yahoo! was valued at $125bn compared to Apple at $15bn).
It was downhill from then.
By the end of the stock market downturn in 2002, shares had lost $5 trillion in value, and the NASDAQ Index had dropped 78% since its peak.
Clearly, all was not lost, however. As we know, the technology boom resurged and from the lows of October 2002 to mid-2025, the index has returned 3,316% (data from FE Analytics 07/10/2002 to 30/06/2025).
The largest company is now $4 trillion in size which is around 15% of US GDP – back in 1995, the largest company was General Electric which was 1.3% of GDP.
It feels like technology is embedded in almost every facet of life and yet we are seemingly on the verge of another new wave that includes artificial intelligence, quantum computing, genome editing, and robotics.
Tricennial returns
Clearly, there are a number of major global events that occurred over the last three decades including the introduction of the euro currency, the September 11 terrorist attacks, the credit crisis, Covid, and many more.
Over this time, often as a result of these events, markets went up and down, but if you had simply invested in 1995 and gone on holiday for 30 years, you would be pretty pleased with the returns overall (which is why we advise to invest for the long term and try to ignore short-term volatility if you can).
Table one shows the percentage total returns over the period.
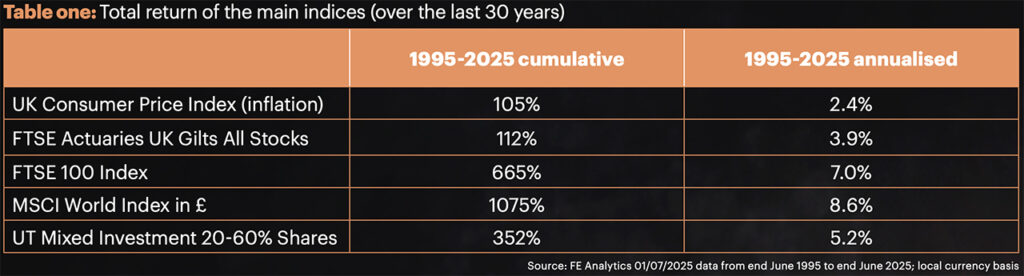
As you can see, equities have done very well over the period but even well-diversified portfolios such as those in the 20-60% Shares sector have returned over three times the level of inflation over the thirty years.
The Equilibrium era
Equilibrium’s discretionary management service commenced at the end of 2007. Since then, we measure 10-year periods every month on a rolling basis, i.e. the first one recorded from 31 December 2007 to 31 December 2017, the second being 31 January 2008 to 31 January 2018, and so on.
This gives us a valuable long-term measure of how we are performing against three main comparators – cash, inflation, and the competition.
Table two summarises how our portfolios and the Mixed Investment sector have done over 91 x 10-year periods against different levels of inflation.
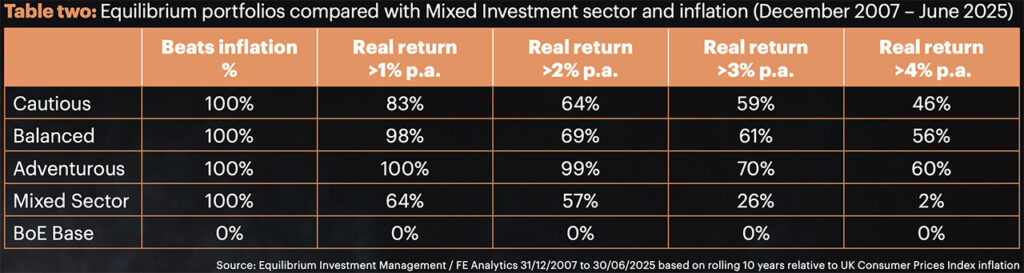
As you can see, our Balanced portfolio, for instance, has had returns of 4% or more ahead of inflation more than half the time since inception compared with just 2% of the time for the sector (and never by cash). Indeed, across the three Equilibrium portfolios, each has beaten cash and the sector over time.
History has shown that it is impossible to build portfolios that will excel year-in, year-out. We always know there is scope for improvements, and we constantly strive to refine and enhance the portfolios. As such, we are determined that going forward our investment process will drive as good, if not better, returns of the last 30 years over the next three decades.
This article is intended as an information piece and does not constitute investment advice. Past performance is for illustrative purposes only and cannot be guaranteed to apply in the future. Investments will fall as well as rise.
If you have any further investment questions, please don’t hesitate to contact us on 0161 486 2250 or reach out to your usual Equilibrium contact.
Sources:
- www.statista.com/uk-internet- penetration
- What Happened When China Joined the WTO? | CFR Education
- US Census Bureau (fred.stlouisfed.org/series/ECOMPCTSA/)