Under the bonnet: The Global Speculative Portfolio

We are often asked by our clients to provide more detailed views of our portfolio and to share our thoughts on how we build them. Whilst we rely on the fund managers we select it’s important for us to look through to the underlying assets we ultimately invest in. Over the coming months we will share some of the detail on our portfolios through a series of blogs.
Our Balanced and Adventurous Equity Portfolios are constructed using a blend of five sub-portfolios; UK Conservative, UK Dynamic, UK All, Global Established and Global Speculative (what we call emerging markets). The below performance table sets out the performance of each of the sub equity portfolios that make up the Balanced and Adventurous Equity Portfolios.
Equilibrium Portfolio Returns
Up to the end of April the Global Speculative has been our best performing equity portfolio over the past 12 months but it has been the worst performing over the past six months. This reflects the higher risk/return profile of investing in emerging markets. This is an important reminder that Investments will fall as well as rise and past performance is never a guide to future performance.
This category of fund currently makes up 17% of the equity in a cautious or balanced portfolio rising to 26% of the equity in an adventurous portfolio. Global speculative is made up of emerging market funds, or more specifically for our portfolios those markets that are outside UK, US, Europe and Japan.
Our Global Speculative allocation is made up of the Goldman Sachs India fund, the Invesco Hong Kong fund and China and Schroder Asian Alpha fund.
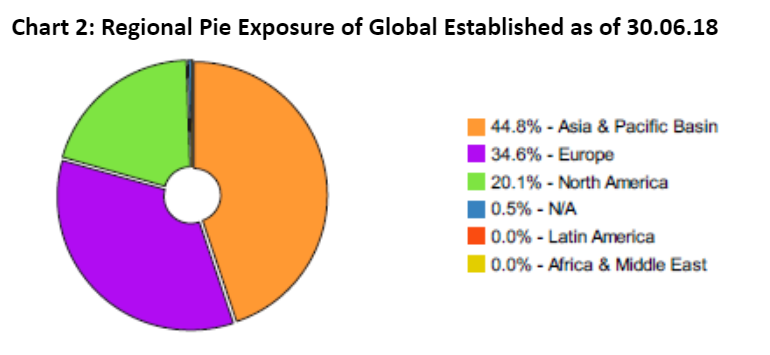
One of the main attractions of Asia is its growth potential as good demographics and improving conditions for wealth generation combine. Domestic growth and scope for overseas expansion provides great potential for increased earnings.
Table 1 compares the Global Speculative portfolio asset allocation to the iShares MSCI Core Emerging Market ETF as benchmark. The valuation metrics reflect a bias to growth stocks compared to the benchmark. Earnings are not necessarily paid out as dividends, hence lower dividend yield, and instead reinvested to build a platform for future growth and increased earnings. Investors wanting to take advantage of future earnings growth must therefore pay a premium through high price to earnings ratio multiples.
Table 1: Valuations
*Portfolio analysis based in Thomson Reuters Eikon Data (30/04/18)
It is possibly no surprise then that the portfolio is dominated by sectors that should thrive in this backdrop; tech at 25% and consumer discretionary at 17% top the sector exposure. More traditional defensive sectors, healthcare 5% and utilities 2%, are less well represented but offer diversification.
Table 2 is based on six months from end October to end April, it breaks the Global Speculative portfolio up into the average exposure to the major sectors over the past 6 months. The ‘return over holding period’ is the return for securities in that sector when they were held in the portfolio that means if we only bought a security at end of December the return over holding period would be from end of December and not end of October. The ‘contribution to portfolio return’ indicates how much returns of stocks in each sector return has benefitted the total return of the Global Speculative portfolio return.
Despite being the fourth smallest sector position, healthcare stocks have contributed the most to the portfolio return.
Table 2: Contribution to returns
*Estimated contribution to portfolio return based on Thomson Reuter Eikon data (31/10/17 – 30/04/18)
Although the portfolio holds 206 stocks, it is reasonably concentrated at top end with the top 15 and top 25 stocks over the past six months making up 29% and 39% respectively of the total on average. Over the past 6 months the largest two stocks, Tencent and Alibaba, have made up on average over 11% of the portfolio.
Both stocks have helped the portfolio performance, but they are now trading on high PE multiples of over 40. Whilst expensive, this is not out of line with the big tech stocks in the US.
We have essentially taken some profits on these stocks over time, from 6.58% to 4.5% for Tencent and 6.62% to 4.2% for Alibaba. Adjusting our portfolio to increase exposure to India has reduced our exposure to these stocks as valuations have become further stretched.
We can never predict what future returns will be, as past performance is not a guide to future performance but understanding what is drives the returns and what risks we are exposed to gives us greater confidence in the decisions we make within portfolios.
Click here to read ‘Under the bonnet: The Global Established Portfolio’
Disclaimer: The content contained in this blog represents the opinions of Equilibrium Investment Management. The commentary in this blog in no way constitutes a solicitation of investment advice. It should not be relied upon in making investment decisions and is intended solely for the entertainment of the reader.